Vivid Trace 2025.1 Feature Tour
This document introduces features of Vivid Trace, an add-on for Atlassian Jira and Atlassian Confluence. This document covers the following topics:
Issue Relation Graphs
Vivid Trace automatically gathers related issues by tracing along related issues using Jira's Issue Linking feature and parent/sub-task relationships using Jira's Sub-task feature, and presents the resulting trace information as an issue relation graph. All issues in the graph are either directly related, or are indirectly reachable by following further along the web of related issues, no matter how distant. An issue that has even many relations will appear exactly once in the graph. Issue relation graphs yield total visibility of all issue relations, even cross-project, enabling you to understand which issues are involved, how they are related, and a variety of other, customizable information.
This graph format faithfully provides the most direct and accurate view of the underlying issue and relationship information. See Issue Relation Graphs for full details.
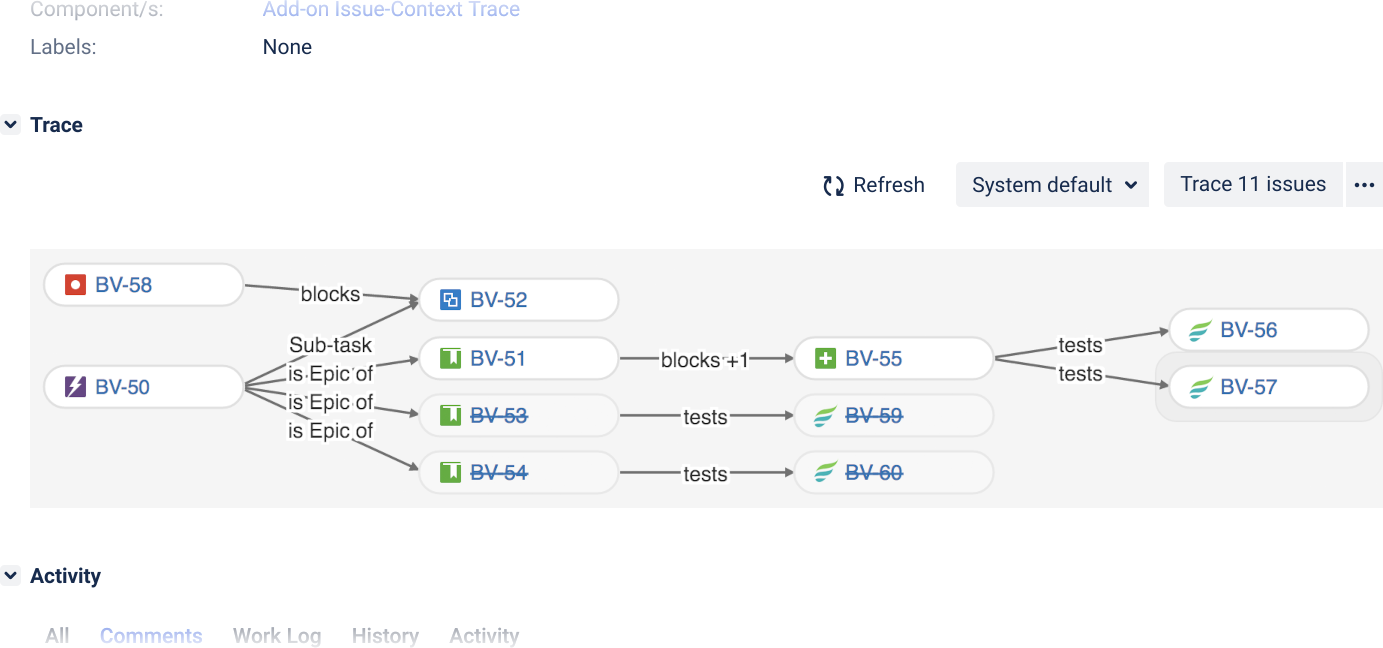
Issues are displayed in individual lozenges, by default with issue type and issue key.
Issue types are shown using Jira's issue type iconography.
Lines connecting issues indicate a direct relationship between the issues with issue links or as parent/sub-tasks.
Relationships are labeled with the nature of the relation. Additional, overlapping relations between the same two issues are denoted with +n.

Resolved issues are shaded and their issue keys are struck through.
The current issue (if any) has a halo.
Quickly navigate to another issue by clicking or tapping it.
The Trace Studio
Accessible from nearly everywhere in Jira, the Trace Studio is a focal point in Vivid Trace. With it, you can visualize related issues, produce traceability reports, conduct change impact analysis, ascertain compliance, and much more. You can design, run, save, tweak, and share traces with parameters that parallel the relations() JQL function suite. You can also design the information display to help you visualize, analyze, and communicate trace results. See Trace Studio for full details, including a quickstart.
Trace arbitrary JQL queries or any number of issues of interest, according to various criteria. Design the presentation of results.
Export the results in a variety of formats or further process the issues.
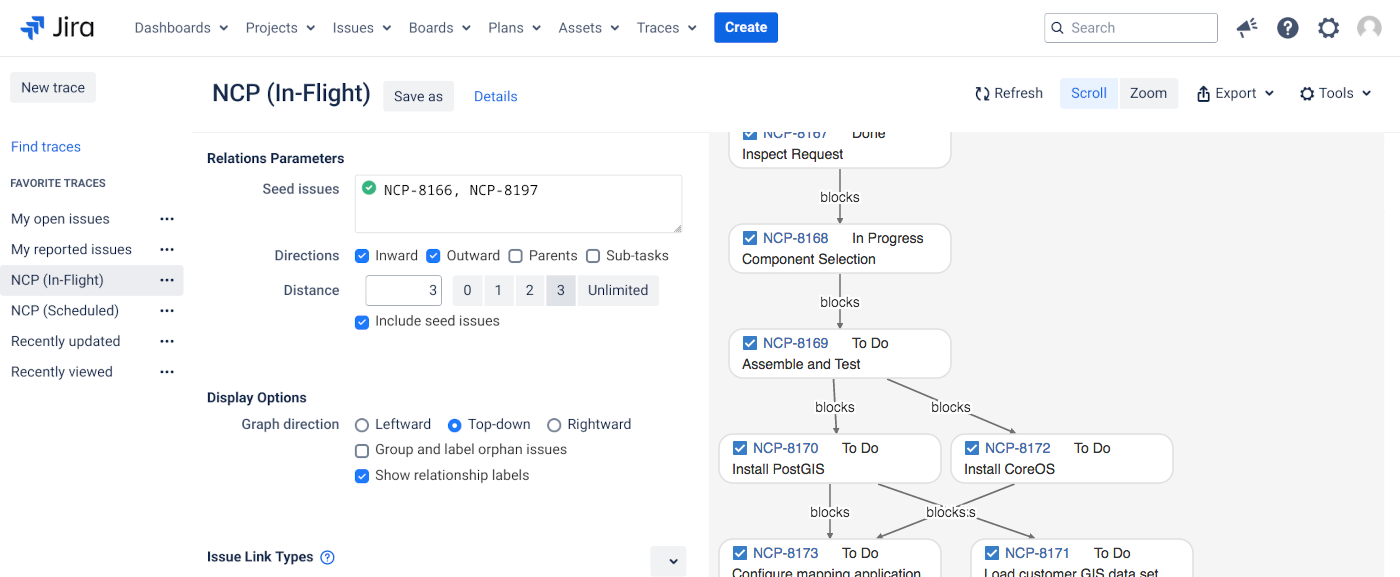
Trace configurations for instant recall using the same tracing criteria on up-to-the-moment data.
Visualization of trace results including issues and their relations.
Context-specific Traces
Vivid Trace provides contextual traces on individual issue detail pages and at the project level. This section details each of these contexts.
Issue Context Traces
The issue context trace displays an issue relation graph for the current issue, according to its associated project configuration. You can access the issue relation graph for a specific Jira issue wherever issue pages are regularly displayed in Jira, including in the issue browser and in the Issue Navigator. You can configure the project to display traces as issue panels or issue activity tabs, and to restrict visibility of traces to certain people.
Note that the graph might not automatically refresh when performing certain issue operations, such as manipulating issue watchers or voters.
The issue relation graph is in the Trace section, accessible when viewing an issue.
Click this section header to alternately hide or reveal the graph. While hidden, graphs won't be processed and shown.
Bring the graph as-is into the Trace Studio to conduct further inquiry, export the graph, or save the trace configuration for future recall.
Change your personal graphing options, perform bulk actions on the graphed issues, or configure the project.
See Context Trace Menu below.
Project Context Traces
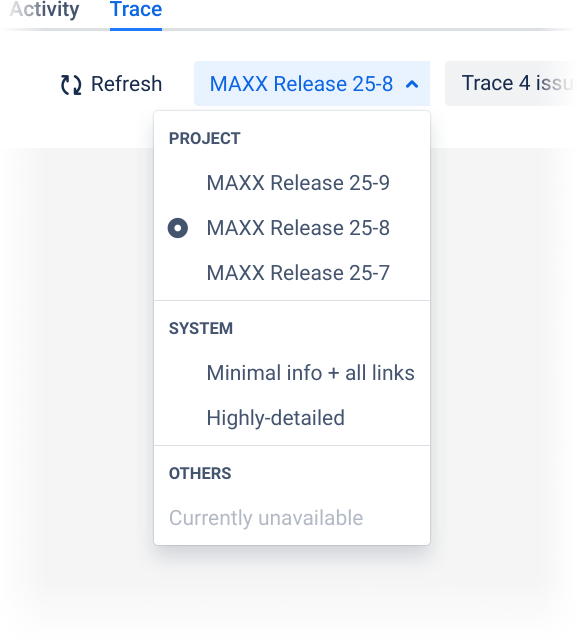
The project context trace displays a trace of issues in the entire project. The graph can depict all issues associated with the project, including their out-of-project relations, according to the active trace configuration. Use the quick list to change the active trace configuration and see project data from different perspectives.
View contextual traces for projects by selecting Trace from the project navigation sidebar.
Instantly refresh the graph in real-time, avoiding the need to reload the entire issue page.
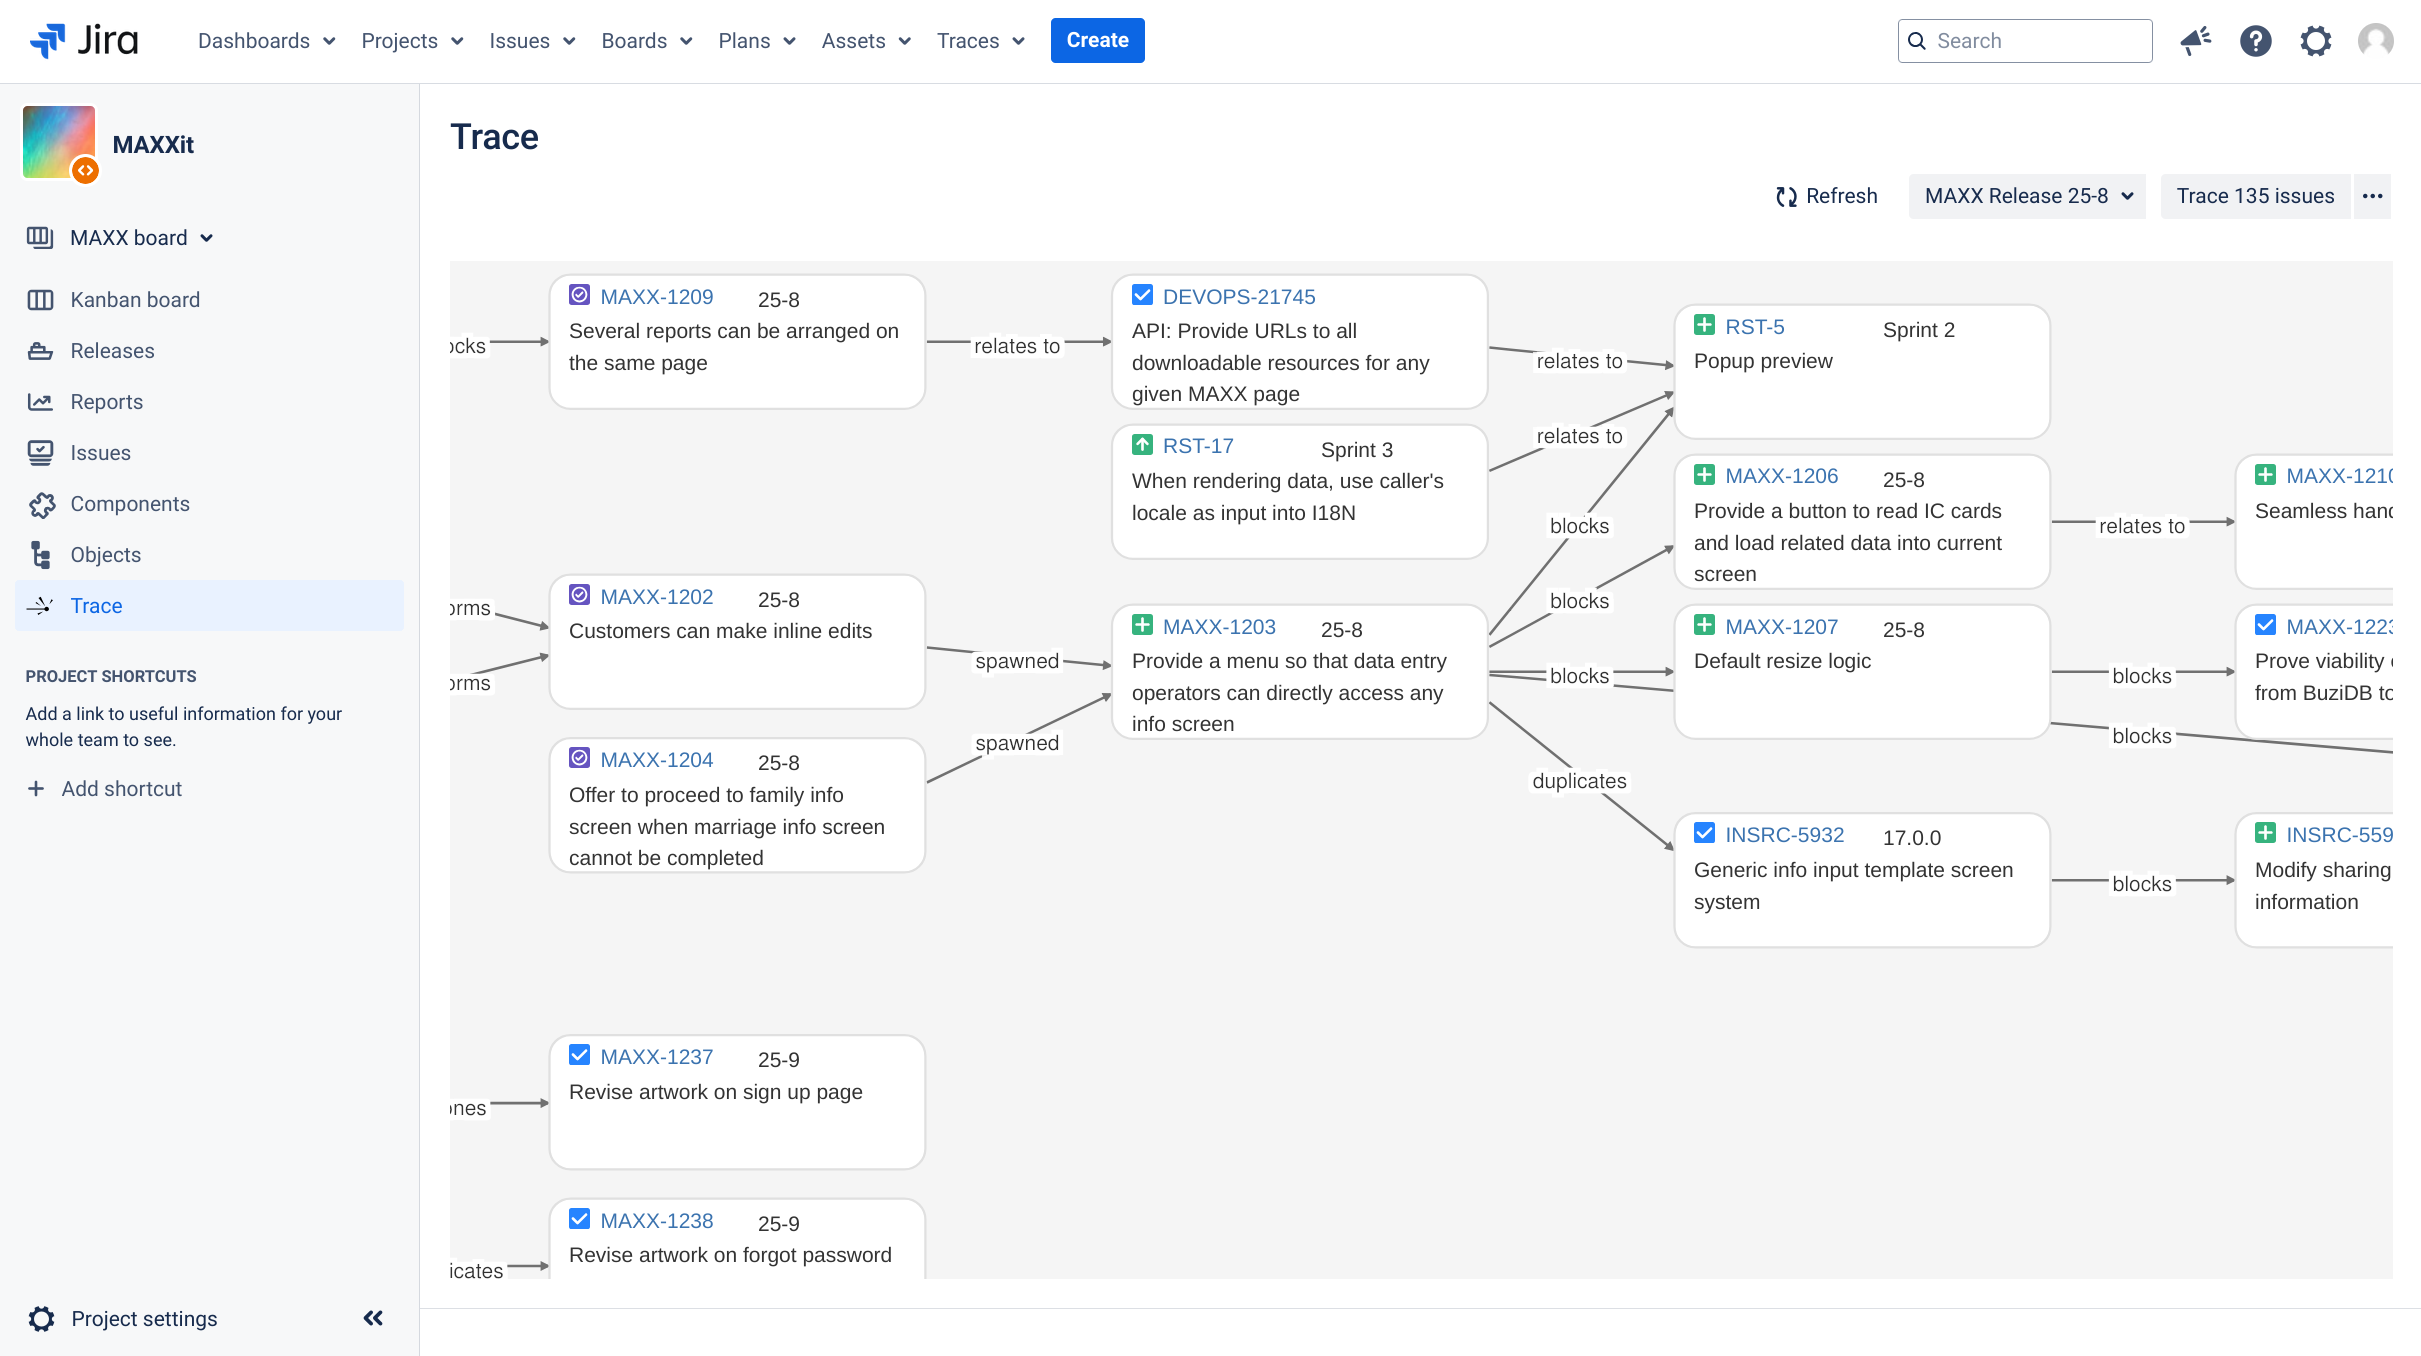
Change the active trace configuration in the quick list to see information relevant to the task at hand.
Context Trace Menu
A context trace menu accompanies contextual issue relation graphs. This menu contains options for changing your personal graphing options, actions that operate on the graph as a whole, and an entry point to the project configuration.
Click or tap the drop-down button to reveal the context trace menu.
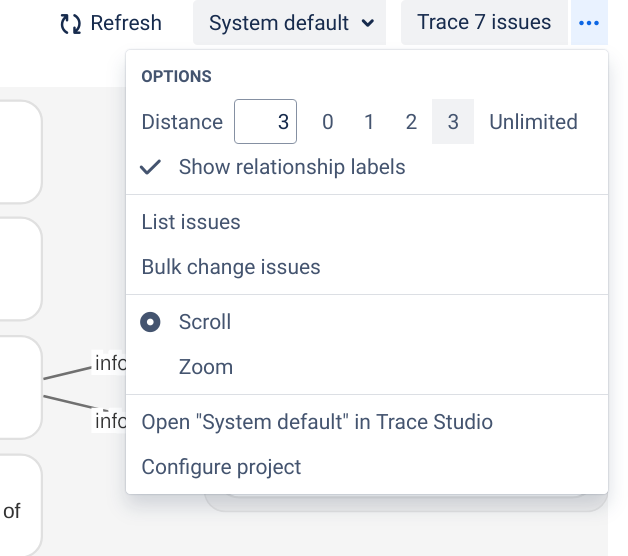
| Distance | Restricts tracing of issue relations to a maximum distance of N issues away from the issues in context.US |
|---|---|
| Show relationship labels | When enabled, the names of the relationships are written on the lines that relate given issues. For issue link relations the outward label is used. Overlapping relations are denoted using the nomenclature +n to indicate that, in addition to the labeled relation, n further relations exist between the two issues.US |
| List issues | Produces a list of issue search results in Jira's Issue Navigator as an advanced JQL search query translated from the current trace. Essentially, it allows you to bring a graph into the Issue Navigator and manage the set of connected issues as a larger, singular unit. For example, you can view the issues in list form with your desired field view configuration, reuse the JQL query as a starting point for further investigation or discovery, or efficiently perform further processing with your other tools. The search results might differ from the issues appearing in the graph if the underlying issue and relation information has changed since the graph was generated. Note that no ordering is specified in the listed issues. |
| Bulk change issues | Perform bulk operations on the issues produced from running the same trace on current Jira data. |
| View mode: Scroll, zoom | Set the view mode to either scroll or zoom. Scroll mode can be helpful when you want to use a tablet pen, trackpad, or mousewheel to move around a graph and also for printing to paper. Zoom is useful for examining large graphs and also for displaying on an overhead projector or during video conference. |
| Open "□△○" in trace studio | Pops you into the Trace Studio with the active trace configuration open. This is a direct way to enter the maintenance cycle of a trace configuration: Open the trace configuration in a new tab, modify the configuration, save your changes, and then back in this tab refresh to see the updated trace results. |
| Configure project | Configure the quick list and visibility for contextual traces within this project. PS |
| PS | Project Settings apply to contextual traces anywhere within the associated project. |
| US | User Settings are personal choices. Such settings can potentially override graph settings, project settings, and system settings. User settings are stored in Jira or within the web browser in use. |
Project Configurations
Individual projects can customize their contextual traces in project settings. The project settings determine which trace configurations are offered in the "Projects" section of the quick list, where issue context traces appear on issue details pages, and to whom traces are shown. These settings take hold for viewers of the project, even if the viewer or indeed graphed issues are coming from other projects whose own home project settings may differ. People with Administer Projects permission are allowed to modify project settings. Use the following procedure to access Vivid Trace project settings.
- Ensure you are granted permission to Administer Projects on the project, or you are a Jira administrators.
- In Jira, navigate to the project of interest.
- Select Project settings in the project navigation sidebar. This opens the Summary page in Project settings. A summary section displays current Vivid Trace settings for this project. Alternatively, from the context trace menu select "Configure project" to jump directly to visibility settings.
- To inspect and modify a particular setting, either click or tap a specific setting in the summary, or choose the appropriate item from the Vivid Trace section in the settings list.
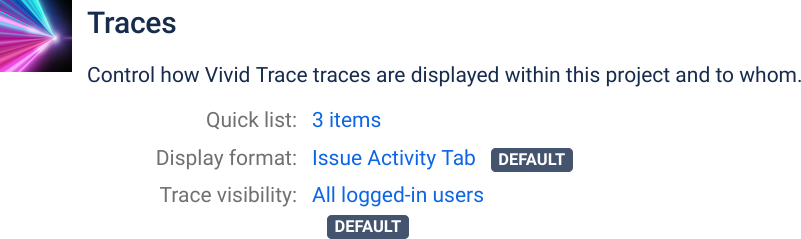
Vivid Trace project settings summary section showing current settings for the project. Click or tap a setting to inspect it in further detail or to alter it.
The following explains each setting in detail.
Trace configuration quick list
Here you can manage the trace configurations in the "Project" section of the quick list that appears along with issue- and project-context traces. Offering a curated list of trace configurations to viewers can help speed project team members and others to get answers. For example, you can add trace configurations for current and upcoming versions, or to assist particular roles such as project managers and QA. By default, the project quick list setting is empty, and in this case the "Project" section will not appear in the quick list.
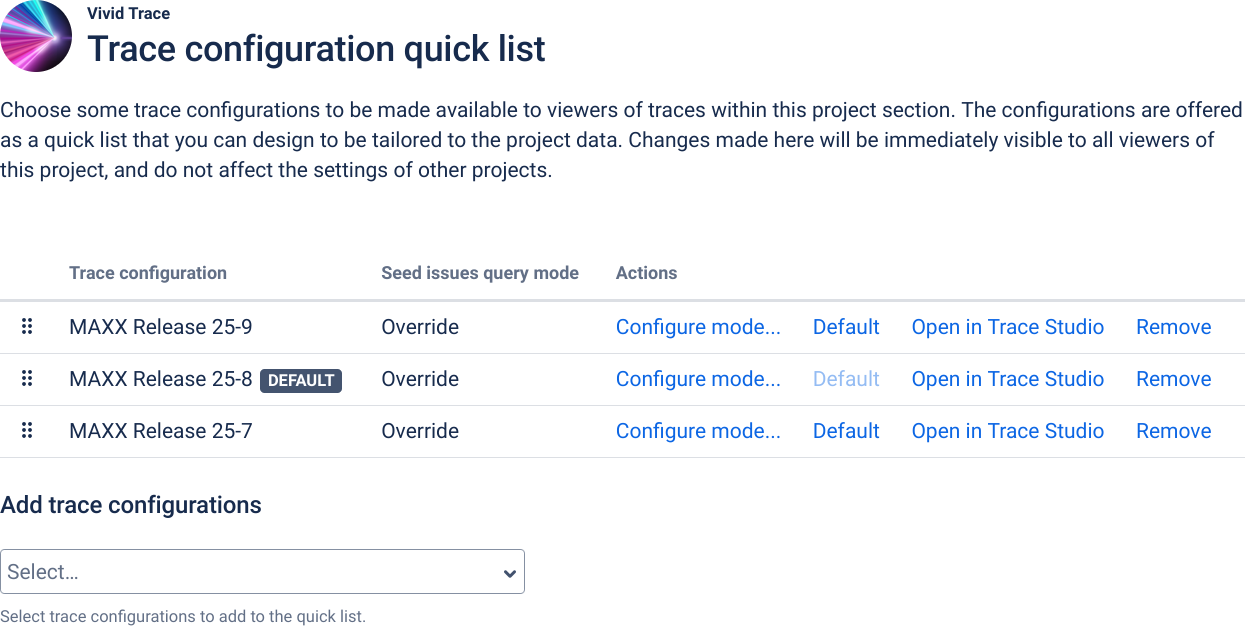
The project-level quick list entries appear in the "Project" section of the quick list. Here you can add, remove, and re-order entries and set the default entry.
Display Format of Traces in Issue Detail Views
Relation graphs on issue detail pages within the project can be displayed either as a panel or as an activity tab. Use this Display Format of Traces in Issue Detail Views setting to select how the graphs will be displayed in your project. Changes made to the project configuration will be immediately visible to all viewers, and do not affect the trace settings of other projects.
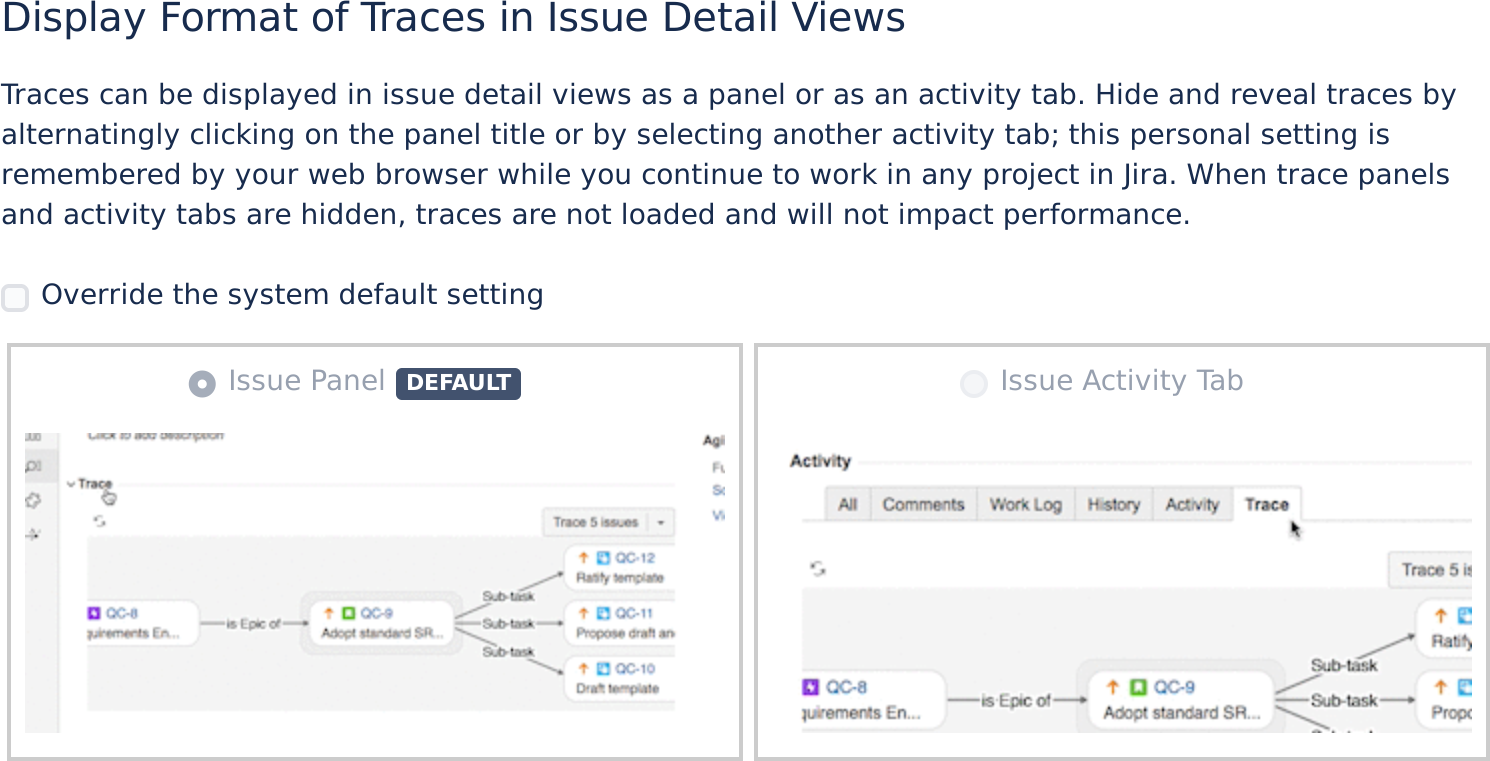
Override the system default value to set your own preference.
When not overridden, the system default setting is automatically applied to your project.
Select your preferred display format for traces in issue detail views.
Visibility of Traces in Issue Detail Views
The Visibility of Traces in Issue Detail Views allows you to selectively limit the display of issue detail view context traces to specific users, hiding traces from unconcerned users, and thus generally improving performance.
By default, traces within the context of the project are visible to anyone who views issue detail pages in the project. To limit display of traces to specific Jira security principals and hide traces from everyone else, adjust the membership list by adding specific project roles, groups, and individual users. Traces will not be shown at all when the list is empty, in effect disabling issue detail view contextual traces within the project. Note that this setting is not a form of security access control; people to whom traces are hidden will still be able to trace issues belonging to the project, subject to security settings.
Changes made to the project configuration will be immediately visible to all viewers, and do not affect the trace settings of other projects.
Override the system default setting to make traces visible in issue detail pages to select viewers within this project.
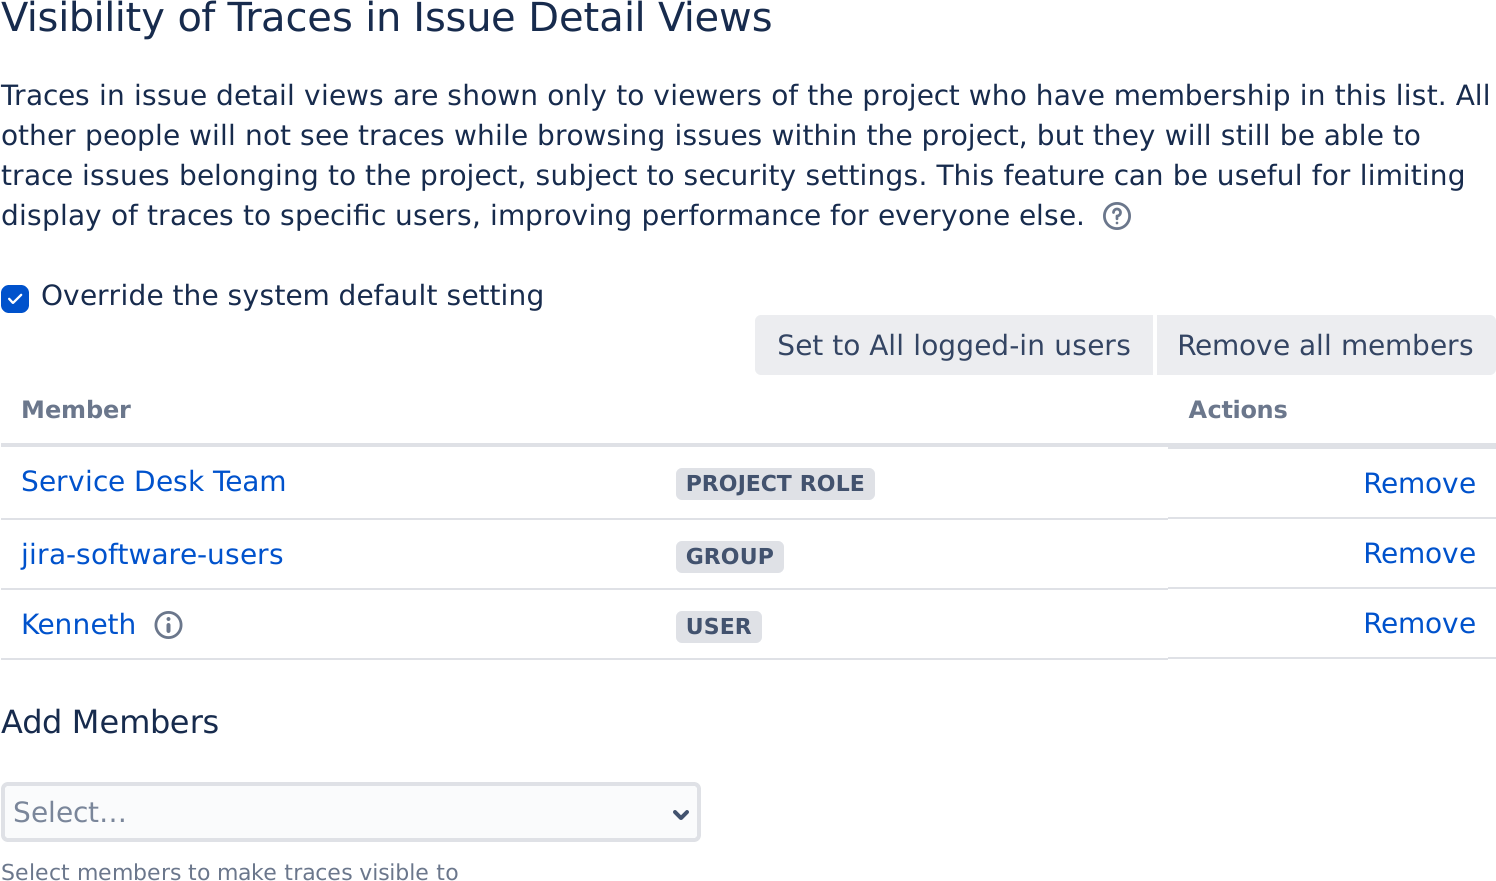
Make traces visible to specific Jira security principals by adding project roles, groups, and individual users to the membership list.
Traces in issue detail views are visible to members of this list. Remove individual entries using the action button.
Global Navigation
The Trace menu is located in the global navigation menu bar at the top of nearly every page within Jira.
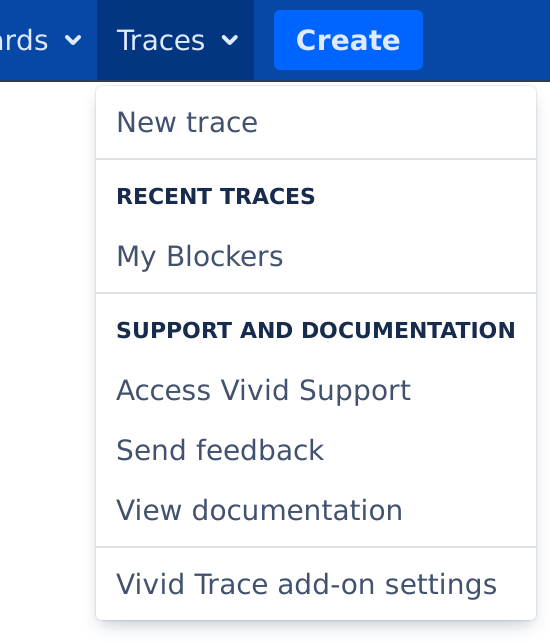
| New trace | Go to the Trace Studio. |
|---|---|
| Recent traces | List of the trace configurations that you have most recently used. Selecting one will open it in Trace Studio. |
| Access Vivid Support | Navigates to Vivid Support. Convenient if you wish to accelerate your adoption or trial of Vivid Trace with assistance from Vivid's Concierge Service (free of charge), are at a certain point in your workflow but are unsure how to proceed concerning Vivid Trace, or wish to report a defect. |
| Send feedback | The Send Feedback feature allows you to provide product feedback directly to Vivid by email, giving you the benefits of customer co-created product improvements without burdening your organization. Vivid only stores and uses feedback information for the purpose of improving our products and services. See our Vivid Data Security and Privacy Notice as well as our Vivid Unsolicited Idea Submission Policy in the Terms of Use for more information on how we use feedback provided to us. Note that we might contact people who supply their contact information in their feedback. This feature is not a support channel; for more information on how to obtain support, please refer to Getting Support. |
| View documentation | Quickly access the Vivid Trace product documentation. |
JQL Functions for Tracing Issue Relationships
Vivid Trace provides a suite of JQL functions for comprehensively tracing issues along their issue link relationships and their parent/sub-task relationships at the aggregate level. Highly customizable, these functions address a wide range of needs, from producing the same list of issues as when viewing an issue relation graph for that same issue, to pinpointing all issues outside a project that are blocking a release, and much more. The JQL function relations() and its siblings relatesWith(), links(), parents(), and subtasks() are all thoroughly documented in the JQL Reference, along with plenty of example JQL queries modelling real-world situations that you can refer to when writing your own queries.
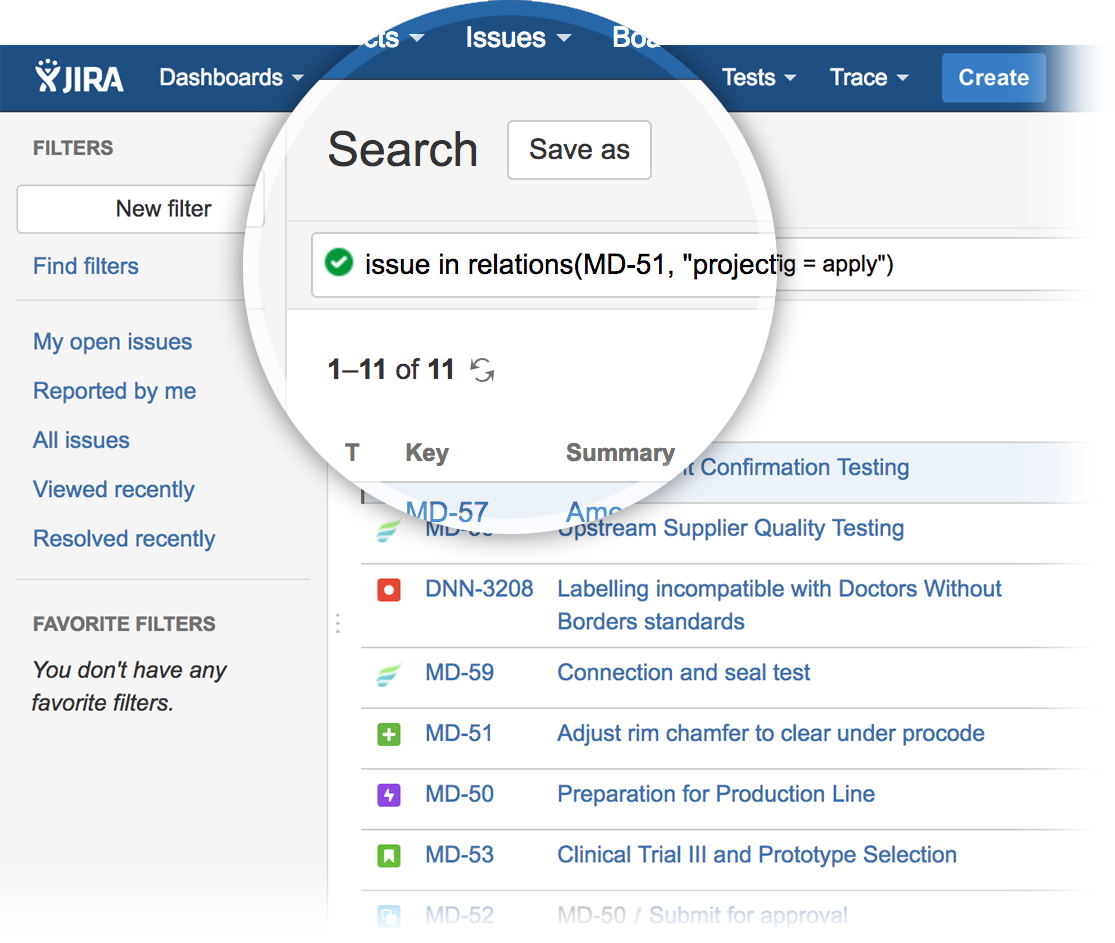
All issues in the issue relation graph can be found with a search using the relations() JQL function. These functions essentially produce the same set of issues as corresponding issue relation graphs but in the form of advanced JQL search results in Jira's Issue Navigator.
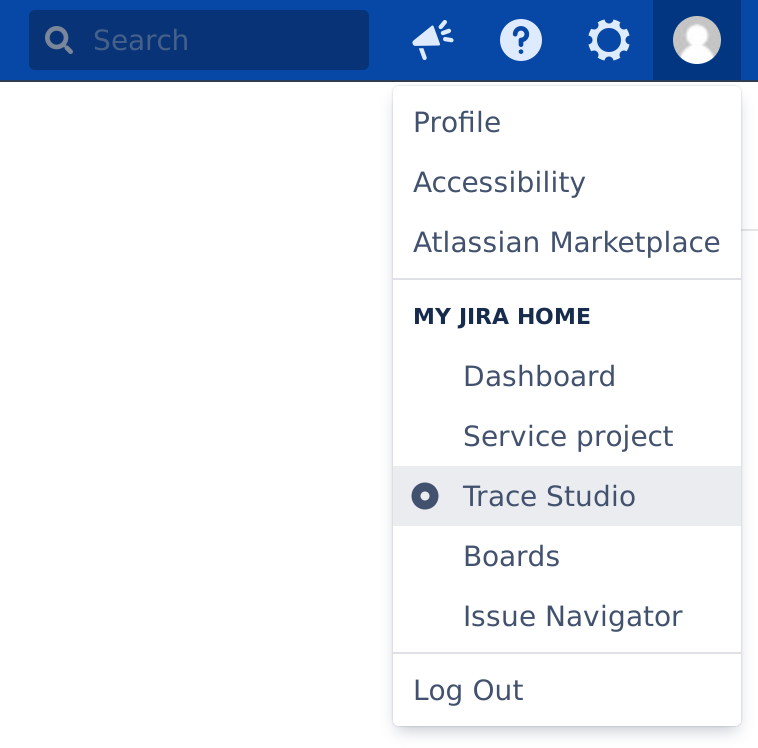
User Account Settings
Your language setting is accessible in your Jira account profile.
You can set your Jira Home to the Trace Studio.
| Language | Change your language in your Jira account profile. Note that while Vivid Trace offers many languages, you may need to ask your Jira administrator to install a Jira language pack matching your choice of language for the purpose of extending support for that language to Jira's own user interfaces. Vivid Trace's open translation management system welcomes improvements and new language contributions.US |
|---|---|
| My Jira Home | You can change your Jira home page to the Trace Studio in Vivid Trace. Having done so, logging in to Jira will bring you straight to the Trace Studio.US |
| US | User Settings are personal choices. Such settings can potentially override graph settings, project settings, and system settings. User settings are stored in Jira or within the web browser in use. |