Vivid Trace 1.3 Feature Tour
This document introduces features of Vivid Trace, an add-on for Atlassian JIRA. This document covers the following topics:
The Issue Relation Graph
Here is your main work-horse. Vivid Trace automatically gathers up related issues by tracing along linked issues using JIRA's Issue Linking feature and parent/sub-task relationships using JIRA's Sub-task feature, and presents the resulting issue relationship information as an issue relation graph. All of the issues in the graph are either directly related, or are indirectly reachable by following further along the web of related issues, no matter how distant. This graph format faithfully provides the most direct and accurate view of the underlying issue and relationship information.
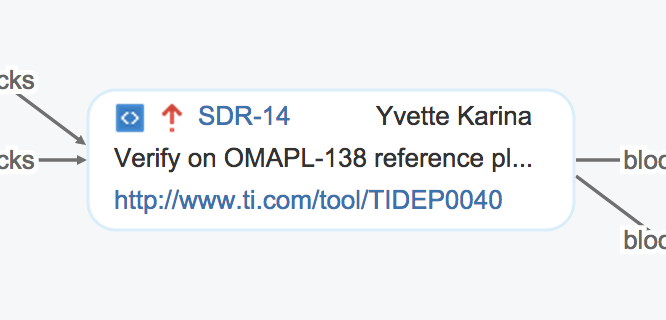
Issues are displayed in individual lozenges, with issue type and issue key.
Issue types are shown using JIRA's issue type iconography.
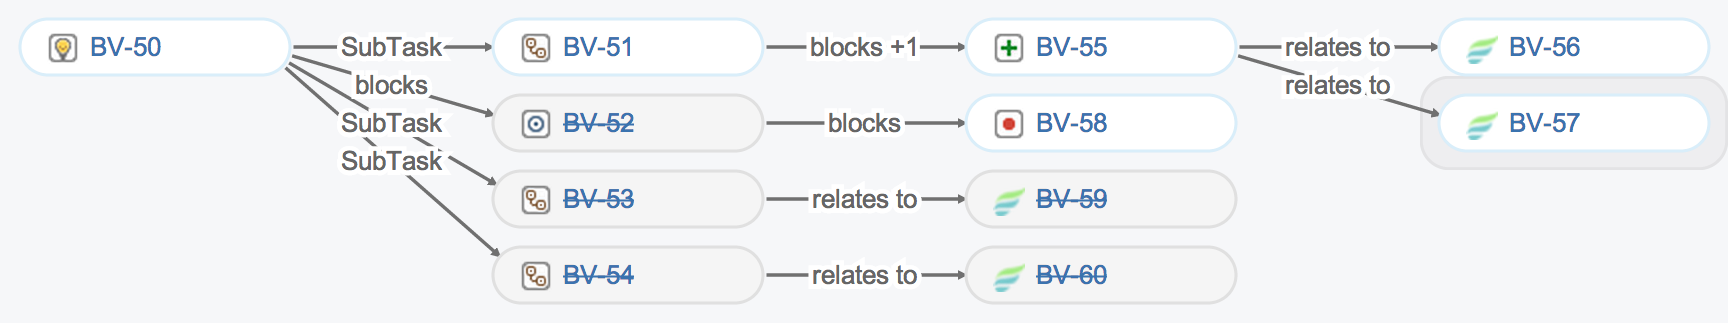
Lines connecting issues indicate that the issues are directly related to one another either with issue links or as parent/sub-tasks.
Relationships are labeled with the issue link type or as parent/sub-tasks. Overlapping relations are denoted with +n.
Resolved issues are shaded and their issue keys are struck through.
The current issue has a halo, indicating the location of the current issue within the larger body of work.
Quickly navigate to another issue by clicking on it or tapping it.
Issue relation graphs yield total visibility of all issue relations, even cross-project, enabling you to understand which issues are involved, how they are related, and what their individual statuses are.
Interpreting the graph in this figure, work has been planned for the implementation and testing of a product feature (BV-50). Four sub-tasks each tackle a portion of the work. An improvement (BV-55) is scheduled for special attention by Quality Assurance, and a trivial defect (BV-58) has been identified while en-route. About half of the workload (by issue count) has been resolved, leaving half pending completion.
Issue relation graphs are always accurate up to the moment they were automatically generated, and are subtly illuminated to naturally focus the human eye on unfinished work. This reduces cognitive load for the routine task of comparing progress with expectations. Whenever conditions change, you'll be armed with the foresight you need to reprioritize remaining work, control for risk, and assure success.
As work progresses, team members relate issues together, building up this valuable information resource. And Vivid Trace's graphs enable you to exploit this information by managing them as larger units of work made visible and traceable, so you can quickly identify progress, gaps, and pathologies. This powerful feature allows you to transcend individual issues and parent/sub-task style relationships, and elevate your team to the more natural idiom of entire issue chains as your unit of management.
Issue Views
You can access the graph for a specific JIRA issue wherever issues are regularly displayed in JIRA, including in the issue browser and in the Issue Navigator.
Instantly refresh the graph without needing to reload the entire page.
The issue relation graph is in the Trace tab, accessible when viewing an issue.
View all of the graphed issues in JIRA's Issue Navigator.
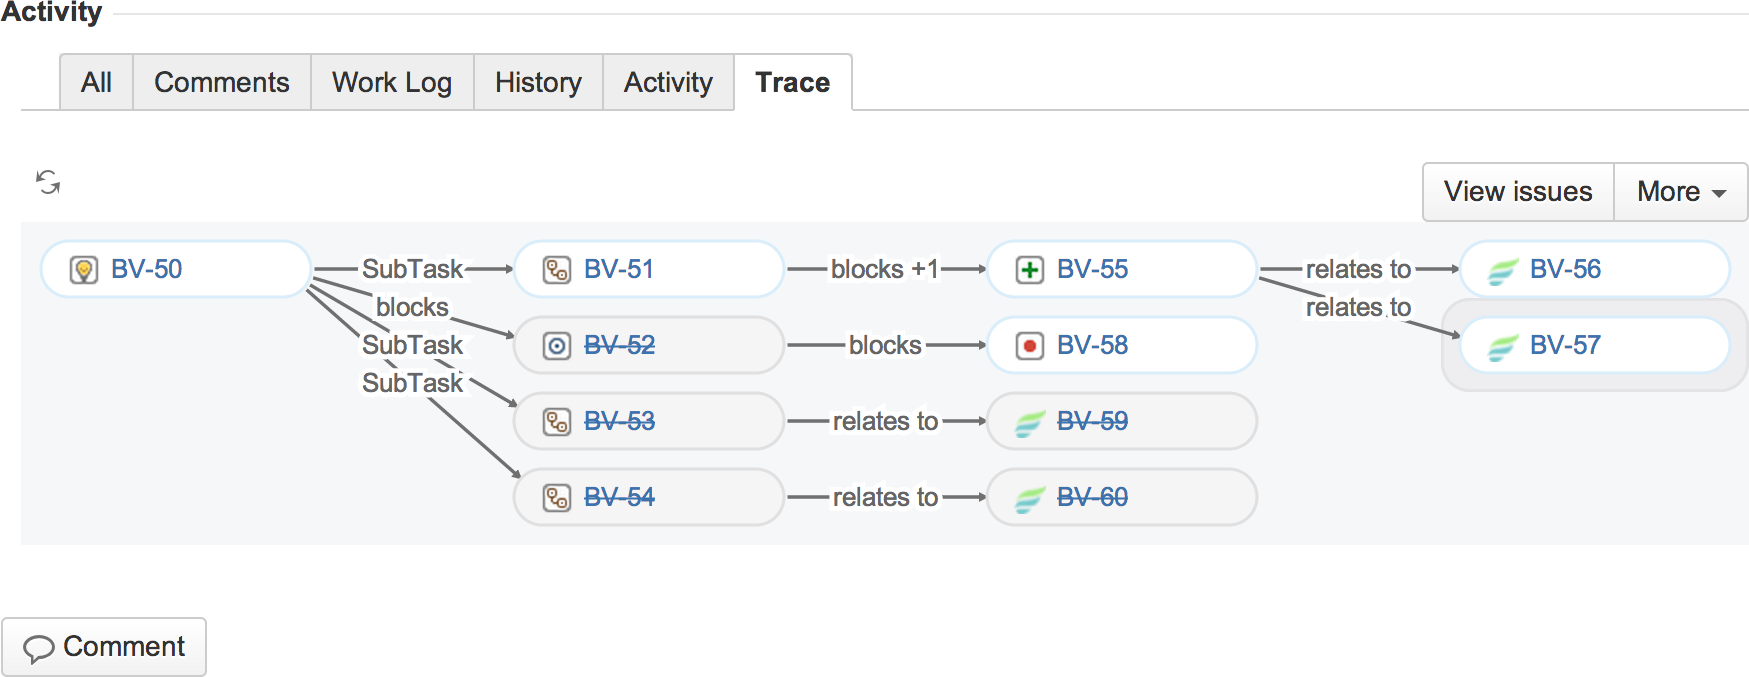
Configure the graph. Applies to all graphs and issues in the project.
You can also toggle display of relationship labels and send feedback directly to Vivid.
The View issues button allows you to manage a set of connected issues as a larger, singular unit. For example, you can use the View issues button to bring every issue in the graph into the Issue Navigator in order to efficiently perform bulk operations, to view the issues in list form with a desired field view configuration, or to even reuse the JQL query as a starting point for detailed inquiry.
The Send Feedback feature allows you to provide product feedback directly to Vivid, giving you the benefits of customer co-created product improvements without burdening your organization. Vivid only stores and uses feedback information for the purpose of improving our products and services. See our Vivid Data Security and Privacy Notice as well as our Vivid Unsolicited Idea Submission Policy in the Terms of Use for more information on how we use the feedback data provided to us. Note that we might contact people who supply their contact information in their feedback. This feature is not a support channel; for more information on how to obtain support, please refer to Getting Support .
Project, Component, and Version Views
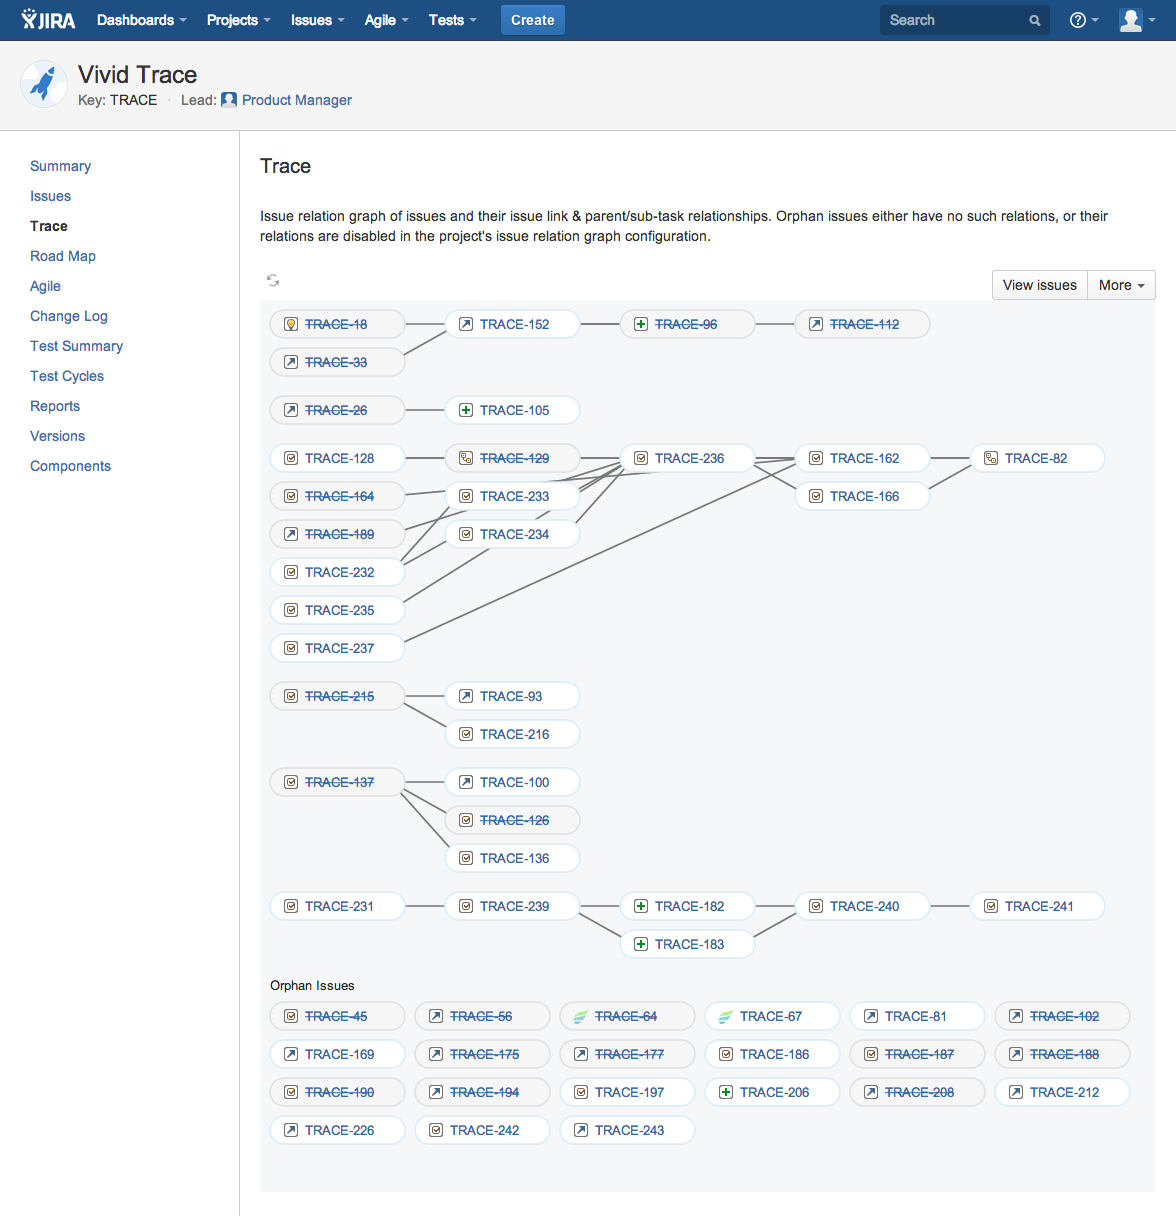
You can also see graphs for an entire project and each of its components and versions. The graph depicts all issues associated with the project, project component, or project version, including their out-of-project relations according to the project configuration. Note that the Component and Version views are not available in JIRA version 6.4, as JIRA 6.4 has removed its project component & version sections.
View the project graph by choosing Trace from the project navigation sidebar.
View the graph for a project's component or version by first browsing the desired component or version, then choosing Trace from the component's or version's navigation sidebar.
Associated issues that don't have relations, or whose relations are disabled in the project configuration, are grouped together as orphan issues.
JQL Functions for Tracing Issue Relationships
Vivid Trace provides a suite of JQL functions for comprehensively tracing issues along their issue link relationships and their parent/sub-task relationships at the aggregate level. Highly customisable, these functions address a wide range of needs, from producing the same list of issues as when viewing an issue relation graph for that same issue, to pinpointing all issues outside of a project that are blocking a release. The JQL function relations() and its siblings relatesWith(), links(), parents(), and subtasks() are all thoroughly documented, along with plenty of example JQL queries modelling real-world situations that you can refer to when writing your own.

All issues in the issue relation graph can be found with a search using the relations() JQL function. The View issues button produces the same list of issues as the corresponding issue relation graph but in the form of JQL search results.
Project Configuration
Adjusting Issue Link Type Enablements
Issue relation graphs are calculated in part by following issue link relationships between issues. Issue links, a standard feature of JIRA, are directional, labeled "outward" and "inward." Vivid Trace follows issue links in both of these directions. The project issue link types configuration determines which issue link types are followed and which types are not when computing graphs from within the project. Uncheck irrelevant link types to trim them from the graphs. Changes made to a project configuration will be immediately visible to all viewers, and do not affect the configurations of other projects. Project administrator permission is required to adjust issue link type enablements.
All available issue link types appear in this list.

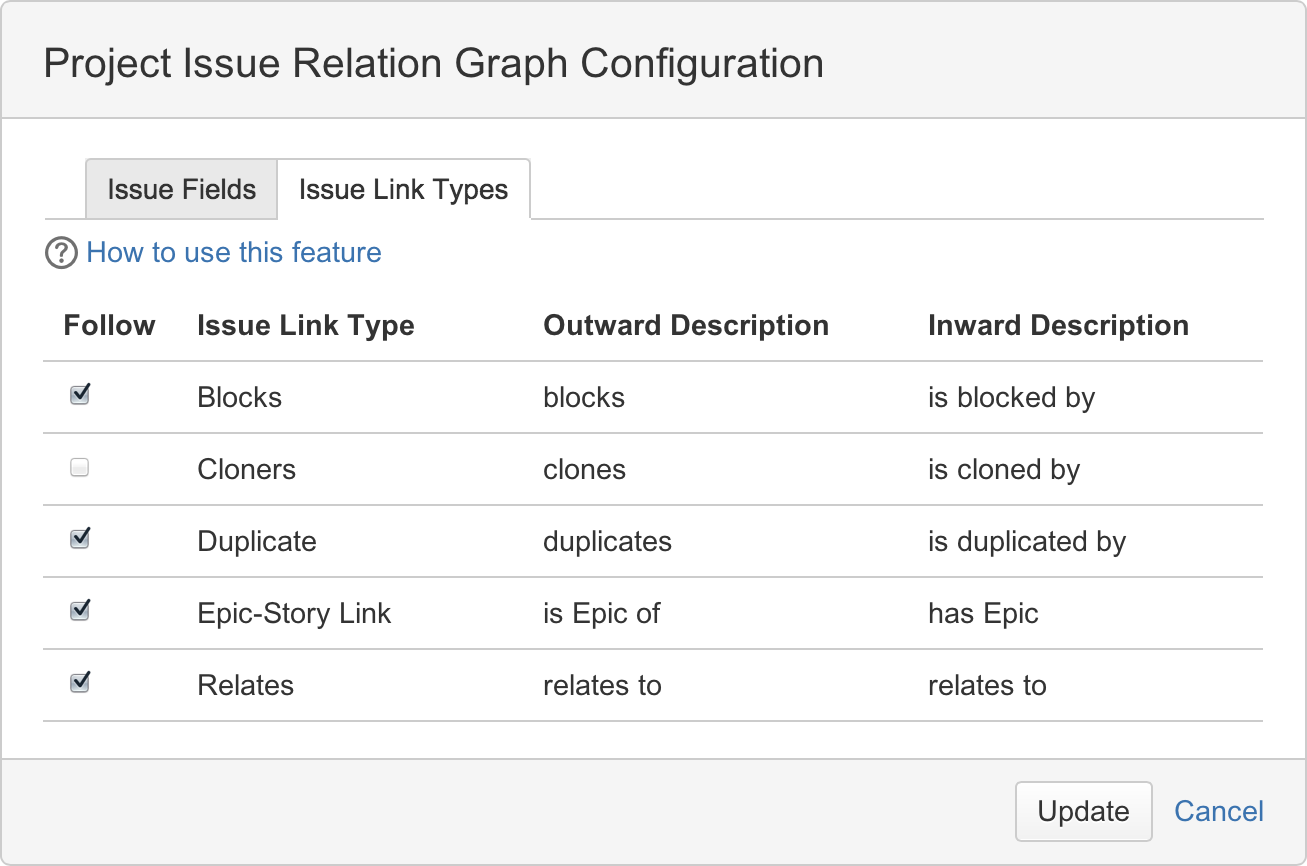
Toggle enablement by clicking or tapping issue link types. Only enabled types are followed and drawn.
Changes are applied when Update is clicked or tapped, at which time changes become instantly visible to all viewers of the project.
For example, if clone relationships are producing irrelevant noise in a project, disable the "Cloners" issue link type. From then on, issue relation graphs will be drawn without following clone relationships, resulting in more concise graphs.
Vivid Trace supports the issue types, sub-task types, and issue link types packaged with JIRA, with those included in plugins such as JIRA Agile and Zephyr for JIRA, as well as with your own custom types. Additionally, JIRA administrators can define new issue & sub-tasks and issue link types to suit your needs, and third-party add-ons can introduce their own.
Customizing Issue Field Layouts
You are able to customize what issue information is displayed in the issue relation graphs. Field data is displayed whenever its corresponding field is part of the issue and has data, otherwise the field will appear blank in the graph. When viewing a graphs in the context of a certain project, issue information display will use the layout for that project, even for issues coming from other projects whose project configuration may be different. The available issue fields lists all issue fields reachable through the project's configurable available issue types; this is the reason why you may spot issue fields you are not familiar with, and is also the reason why it might not list all issue fields available in your system.
Move an issue field within the layout by dragging & dropping it in the desired location.
Remove an issue field from the layout.
Quickly find an issue field by typing in part of its name.
Palette of all issue fields available in this project. Click or tap a field to add it as a new row, or drag & drop a field at a desired location in the layout.
Remove a row and its fields from the layout.
Add a new, blank row to the bottom of the layout.
Design the issue field layout by arranging issue fields in rows.
Issues in the issue relation graph are drawn according to the issue field layout configuration.

The Visualization Guide has full details on which built-in fields and custom fields are supported by Vivid Trace.