Vivid Trace 1.4 Getting Started
Welcome! This document describes how to install and begin using a free trial of Vivid Trace in your own Jira system. It goes on to list resources that will help you and your teams quickly reach proficiency and productivity.
Prerequisites: To follow along, you need Vivid Trace installed, or to be able to install the Vivid Trace add-on into a correctly-functioning Jira system (see the Specifications for requirements), perform a re-index, ensure that issue linking and/or sub-tasks are enabled, and have access to a project with linked issues whose data you'll visualize.
Approximate time required: 10 ~ 15 minutes.
- Install a Free Trial of Vivid Trace into Jira
- Premise and Concepts
- Visualize Issue Relationships
- Link Issues Together
- Adjust the Project Configuration
- What Next?
Install a Free Trial of Vivid Trace into Jira
If Vivid Trace is already installed into your Jira system and you have a valid license (bought or free-trial) then skip this section.
Navigate to "Find new add-ons" in Jira's Add-ons Administration section, and then search the marketplace for Vivid Trace. Click or tap "Free trial" to begin the installation process. Alternatively, you can also download the add-on software and install it manually into your Jira system. The Administration document has detailed installation instructions.
Search for vivid trace in the Atlassian Marketplace.
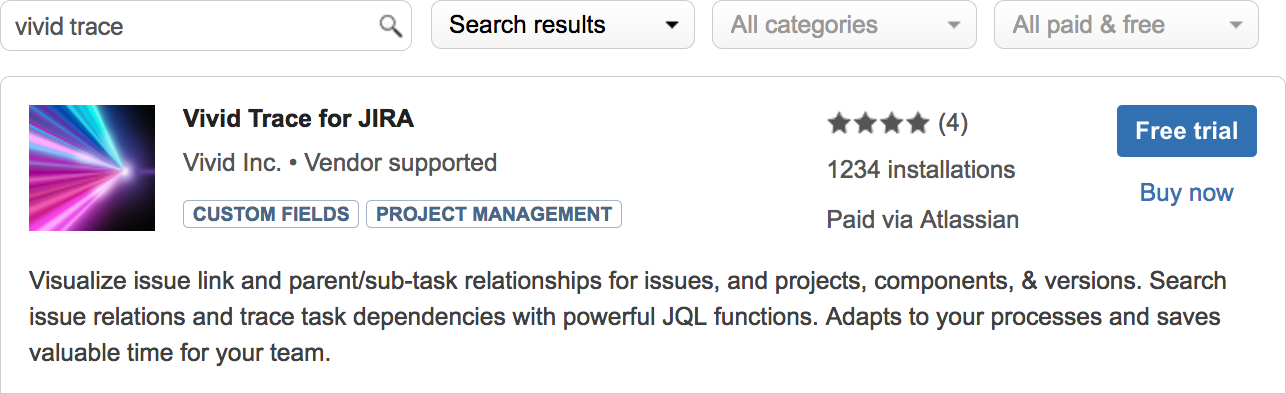
Install Vivid Trace by selecting either "Free trial" or "Buy now" and following the directions.
Free trial license: The installation process through the Atlassian Marketplace might have lead you through the process of obtaining a free trial license and applying it to your Vivid Trace installation. If not, obtain a free trial license now from the Atlassian Marketplace and apply it to the Vivid Trace add-on in Jira administration. Alternatively, you can obtain a trial license from a Vivid Partner. The Administration document has detailed licensing instructions.
Perform an on-line reindex. Vivid Trace is ready for use after the re-index operation finishes.
Premise and Concepts
Vivid Trace finds and maps out related issues and presents visualizations of the resulting trace information. Think of task dependencies, work breakdown structures, and blocked issues: You can use Vivid Trace to search, discover, visualize, and report on issues and their relationships.
Range of Traceable Project Artifacts: The Vivid Trace proposition is traceability between project artifacts, currently defined as issues inside a single Jira instance. Source code commits, test case information, Confluence objects, issues in multiple Jira instances, and other project artifacts are slated to come into direct range in ensuing releases during (see Vivid Trace Product Roadmap).
To use Vivid Trace well you need to be aware of the following concepts.
- Issue: Jira issues. Likely representing work artifacts in your projects.
- Issue Relationship: A relationship between two issues. For example, issue A blocks issue B, or issue Y is a sub-task of issue X.
- Issue link: A link relation between two issues, using Jira's Issue Linking feature.
- Parent/Sub-task: A relation between an issue (the parent task) and a sub-ordinate issue (the sub-task), using Jira's Sub-task feature.
- Trace: The action or results of mapping issues and their relations.
- Graph: A graphical visualization of issues and their relationships. In Vivid Trace, these are issue relation graphs.
Visualize Issue Relationships
Let's visualize some issue relationships.
- Find an epic issue, a blocked issue, or a sub-task that you are working on or have in mind. In fact, any issue will do as long as it has links to other issues.
- Navigate to that issue's detail page in Jira.
- After opening the issue detail page, scroll part way down the page and you will see a Trace panel.
The Trace panel containing the visualization on the issue detail page.
Issue BV-55 is directly related to the current issue with the "tests" issue link.

Other issues are indirectly related to the current issue, lying beyond the directly linked issue.
Your current issue is adorned with a halo.
The graph is interactive: You can click on issues to immediately navigate to their issue detail pages, hover over an issue or relation to bring its immediate relations to the fore, and hover over abbreviated issue fields to see their full contents.
Try looking at traces for other issues. Perhaps you'll notice something where you think "ah-ha!", or find a questionable situation that was hiding in plain sight — until now.
Link Issues Together
Let's see how the graph responds when we link the current issue to another Jira issue. Note that the links you create in this step can be easily deleted within the Issue Links panel in the issue details page. Refer to the Jira documentation for information on linking issues.
- Select the Link menu item from the More dropdown menu, near the top of the issue details page.
- Choose an issue link type from the "This issues" selector.
- Input one or more issues into the Issue field. The new issue links will be established between these issues and the current issue.
- Click or tap the Link button to establish the issue link relationships and return to the issue detail page.
Adjust the Project Configuration
Next, let's adjust the trace configuration of a project that you have Administer Projects permission for. The project configuration influences how the trace proceeds and what issue information is displayed in the results. Note that changes to the project configuration affect all viewers of the project.
- Select "Configure project..." from the trace context menu.
- Switch to the Issue Field Layout tab.
- Add some issue fields of interest to the issue field layout, such as Assignee, Fix Versions, or Summary.
- Click or tap the Update button to apply the changes to the project configuration.
Click or tap the drop-down button to reveal the context trace menu.
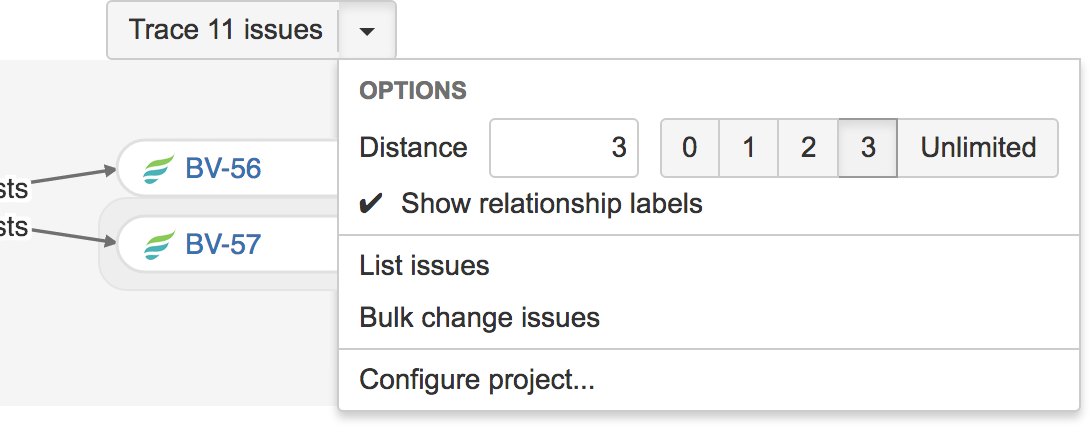
Select Configure Project... to begin adjusting the project configuration.
After updating the project configuration, the graph will automatically refresh. Notice the changes in the graph: Each of the issue lozenges now display the additional information (if available) according to the issue field layout. You can add and arrange as many of the fields as you like, designing the information display to suit your needs.
What Next?
Quickly learn about what else you can do with Vivid Trace by scanning over the Feature Tour, doing the Trace Studio Quickstart, and browsing the list of topics in the Solution Guide.
Tell your teammates. They will also see traces on their Jira issue pages and might be wondering about the new additions. Share this Getting Started document with them.
Make Jira speak your language with additional language packs.
Familiarize yourself with Vivid Trace's capabilities and the list of product information resources by looking over the product documentation index.
Take advantage of Vivid's Concierge service (free of charge) to help you quickly become productive with Vivid Trace.
Have questions? Contact a Vivid Partner
Contact Vivid directly at Vivid Support or by email.