Vivid Trace 2021.1 Trace Studio
Accessible from nearly everywhere in Jira, the Trace Studio is a fundamental feature of Vivid Trace. Its premise is to place the full power of Vivid Trace into your hands to trace issues and their relations over the entirety of your Jira system while benefiting from its data-centric operation, rapid feedback cycle, and outcome-driven design. With it, you can visualize related issues, produce traceability reports, trace the current status of outcomes of customer support requests, conduct change impact analysis, ascertain compliance, and much more. You can design, run, save, and tweak traces with parameters that parallel the relations() JQL function suite. You can also design the information display to help you visualize, analyze, and communicate trace results. This document explains how to use the Trace Studio in terms of these outcomes.
Prerequisites: Familiarity with Issue Relation Graphs. Some knowledge of JQL, Atlassian's Jira Query Language for filtering issues.
At Vivid's Concierge Service you can schedule a walk-through of the Trace Studio and any other aspect of Vivid Trace (free of charge).
Quickstart
This section helps orient you to the Trace Studio's user interface, guiding you towards self-proficiency. Approximate time required: 10 minutes.
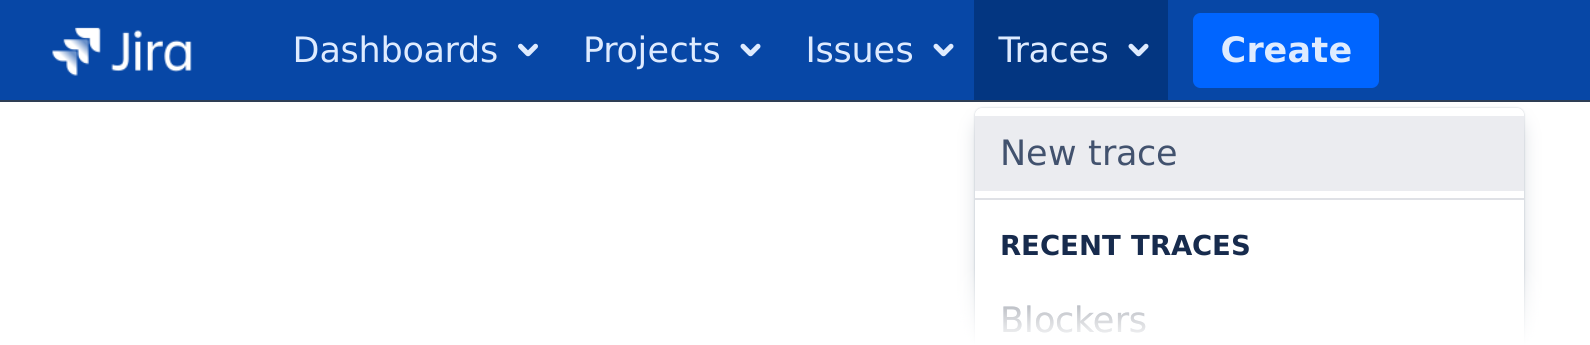
- Go to the Trace Studio within Jira to begin a new tracing session. Select "Trace" from the global navigation menu bar at the top of the Jira page, and then select "Trace issues".
- Input seed issues criteria into the Relations Parameters. The seed issues specify which issues to start tracing from. Use either a valid JQL statement or a list of issue keys. Here are some ideas for use as starting points:

-
project = "CRM Connector" AND fixVersion = "1.2.3"A release version in one of your projects -
priority = HighestRelease blockers -
component = "Memory cache"A particular project component -
votes >= 50Highly-voted issues -
project = ABC AND fixVersion = "1.2.3" AND issueType = RequirementRequirements satisfaction for a release -
duedate >= 6m AND resolution IS EMPTYUnresolved issues long-past due date -
filter = "Tier 2 escalations"Issues in a saved filter -
project = ABC AND issueType = Epic AND resolution IS EMPTYUnfinished epics in a project -
assignee = currentUser() AND resolution IS EMPTYUnfinished issues assigned to you -
duedate <= 1wIssues due around now -
ABC-123, ABC-127Any number of issue keys of issues of interest, such as for blockers, epics, or sub-tasks (separated with spaces and/or commas) -
project IS NOT EMPTY
-
- After inputing the seed issues criteria (and with your cursor still in the Seed issues field) press the Enter key to run the trace. The issue relation graph appears dimmed while the trace executes.
- When the trace completes, an issue relation graph appears with the results of your trace. Inspect the results. Do you recognize some of the issues and their relations in the graph?
You can adjust your seed issues query, pressing Enter after each adjustment to re-run the trace. Note that if the seed issues don't have issue links or parent/sub-task relations, or there are no issues in Jira for you to access, the trace results won't be impressive and the value of the Trace Studio won't be apparent.
Now let's experiment with the Trace Studio's iterative, rapid-feedback approach to developing traces and inspecting data while reducing your cycle time. This process will be more meaningful if you have a specific goal in mind.
Experiment with trace configuration settings. In Relations Parameters, try setting the distance to 0 (zero) and then slowly incrementing it one-by-one to better grasp how distance works. You can graph the exact results of JQL queries by setting the distance to 0. Adjust some Display Options to influence how the results are graphed and arranged. Add fields to the Issue Field Layout to produce more information about the issues in the results, such as the Summary field. Try disabling irrelevant Artifact Types and Issue Link Types to improve signal-to-noise in the graph.
To save your trace configuration: If you've made a trace you'd like to refer to later, save it by selecting "Save as" in the Current Trace and providing a name for the trace. The newly saved trace configuration appears in the list of Favorite Traces. You can confirm that the trace configuration has been properly saved by starting a New trace to re-initialize the Trace Studio and then selecting your saved trace configuration to load it back into the Trace Studio.
To export the trace results, use the Export button in the Toolbar to export the graph in the file format of your choice. A file will be downloaded. Locate the downloaded file, and open it to inspect the results. The selection of file formats enjoys wide-spread compatibility with other software and services meaning that exported files can be used as you see fit, such as to be embedded in other documents like Microsoft Excel spreadsheets and Word documents, or sent to other people.
At this point, hopefully you have a sense for what you can accomplish with the Trace Studio. As you gain proficiency, it all comes down to asking the right questions through the seed issues and the other tracing criteria, and in designing the information display of the results.
User Interface
This section provides an overview of the Trace Studio user interface and then proceeds to detail each of its constituent parts. The user interface is composed of several panels and toolbars that surround a results panel. The results displays the issues and relations of your current trace results as an issue relation graph. This overview is interactive: click, tap, or hover the mouse to focus on specific parts of the user interface.
| Favorite Traces | Instantly recall and execute saved trace configurations on current Jira data. Manage favorite traces. |
|---|---|
| Current Trace | Indicates the currently active trace. Provides the means to save, update, and share trace configurations for future recall. |
| Toolbar | Provides features for operating on the trace as a whole and for generating reports from the graphed results. |
| Relations Parameters | Specify which issues to start tracing from and how the trace should proceed. |
| Display Options | Control arrangement and appearance of issues and relations in the trace results. |
| Issue Link Types | Control which issue link types are followed and ignored during tracing. |
| Artifact Types | Control which issue types are followed and ignored during tracing. |
| Issue Field Layout | Design the issue field information that appears in issue lozenges in the resulting graph. |
| Issue Relation Graph | Results of the most recent successful run of the current trace, represented as a graph of issues and their relationships. |
Favorite Traces

Click to alternatingly hide and reveal the Favorite Traces side panel to increase viewing space and reduce distraction.
Click to reveal a menu of operations for a trace configuration.
Select a trace configuration to load it.
Instantly recall and execute trace configurations on current Jira data, and manage traces.
| New trace | Reinitialize the Trace Studio and start a new trace, discarding any unsaved changes. |
|---|---|
| Find Traces | Search for trace configurations that have been shared with you. Manage your favorite traces. |
| Rename | Change the name of the trace configuration. |
| Duplicate | Copies all settings of the trace configuration, making a duplicate of it under a new name. |
| Remove from favorites | Remove a trace configuration from your list of favorites. |
| Delete | Permanently delete the trace configuration. |
Once created, trace configurations can be saved for later recall, allowing you to regenerate the trace with its particular settings but executing on current Jira data. Loading a trace configuration, by clicking or tapping it, sets it as the active trace in the Trace Studio. The current trace session is discarded and the loaded trace immediately executed.
Use Find traces to find and add trace configurations to your list of favorites.
Saved trace configurations are susceptible to changes in the various Jira objects used in their trace configuration. If those objects change in name, or are deleted, then recalling affected traces might result in missing information, misleading results, or errors. Examples of such objects includes referring to custom fields and projects by name in the seed issues criteria. For this reason, we recommend that you confirm the validity of the trace configuration and examine any warning and error messages whenever the trace results are important. Alternatively, you can consider the use of object IDs as reckoned by Jira, which trade readability for stability.
Find Traces
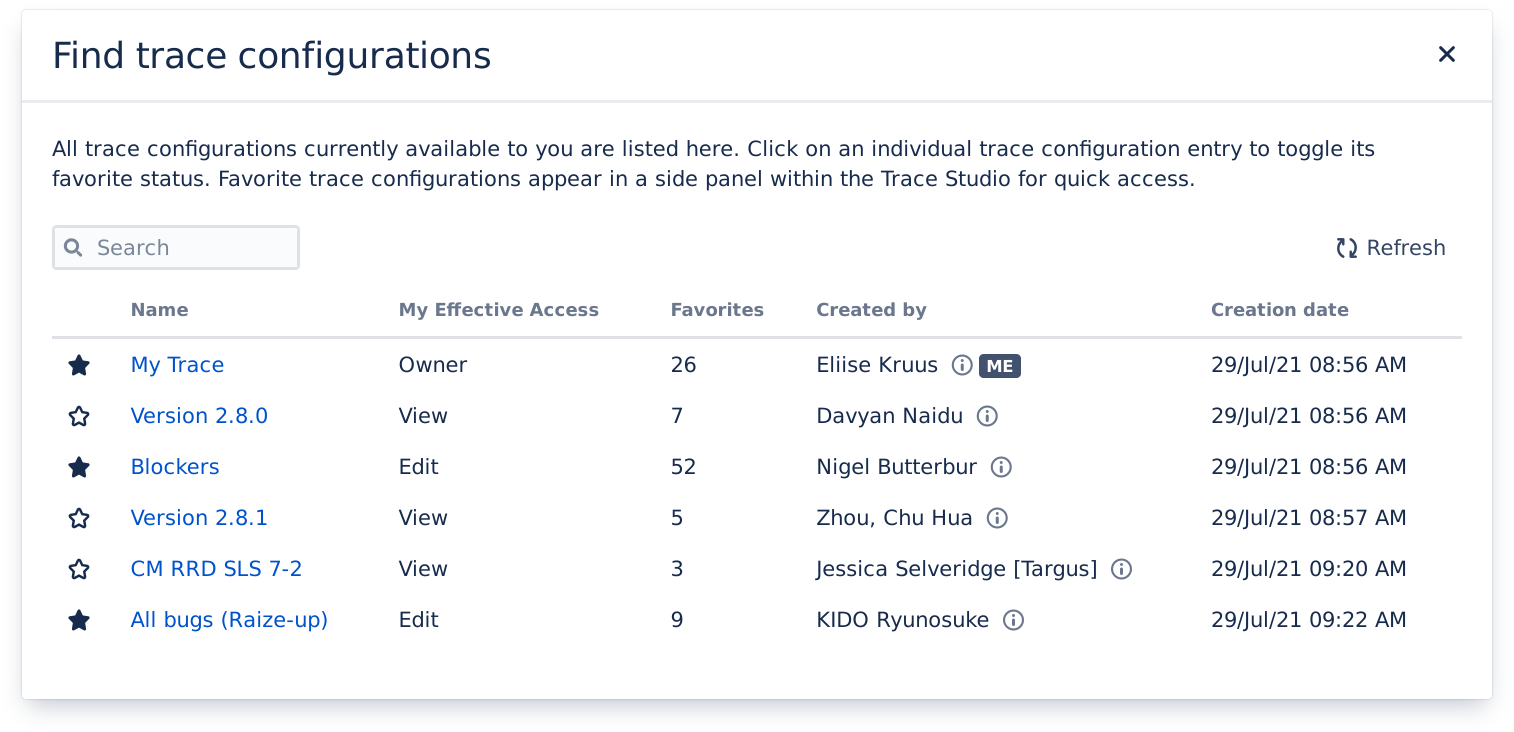
Click or tap the star to toggle the favorite status of a trace configuration.
| Search trace configurations | Search the list of trace configurations by name, security principal, or effective access. |
|---|---|
| Refresh | Refresh the list of trace configurations. |
| Name | Name of the trace configuration |
| My Effective Access | The access or permissions that the trace configuration's Sharing Permissions effective grant to you. |
| Favorites | A count of how many people currently have the trace configuration marked as a favorite. |
| Created by | The user account that originally created the trace configuration. Might be blank if the account is no longer available or has been anonymised. |
| Creation date | When the trace configuration was first created, first saved. |
Favorited traces are listed on the side of the Trace Studio, giving you quick access to each of the traces that you have favorited. All of the trace configurations you've created are listed here, along with trace configurations whose sharing permissions grant you access.
Current Trace
Name of the current trace configuration.
Click or tap to reveal more operations for the current trace.
Indicates that changes have been made to the current trace configuration since it was last saved.
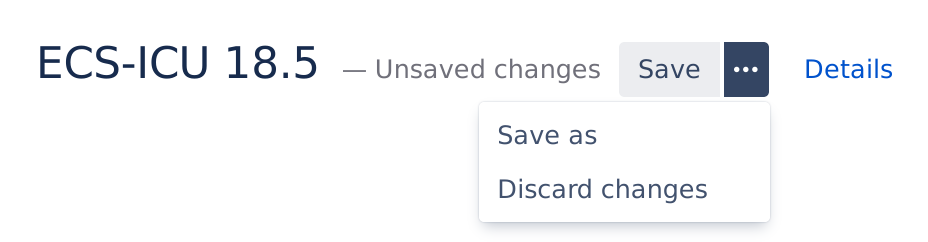
This component indicates the currently active trace and provides means to save and update named trace configurations for future recall.
| Save | Save the current trace configuration. You will be prompted for a name in the case of a new trace. |
|---|---|
| Save as | Saves the current trace configuration as a new trace configuration with the name of your choice. Even if you use the same name as an existing trace, a new trace will be created. |
| Discard changes | Reloads (reverts back to) the current trace configuration, discarding any changes made to it since it was last saved. |
| Details | Inspect the metadata of the current trace configuration and see or update its Sharing Permissions. |
Current Trace Details
Inspect a trace configuration's metadata or change its name.

Use the details inspector of the current trace configuration to confirm trace metadata and modify its sharing permissions.
Add and remove members and set their permissions on the trace configuration.
Trace configurations can be shared with people so that they may find and favorite the traces. When you create a trace configuration, you automatically become its owner and no one else is able to access it. This is in fact the initial setting of the trace configuration's sharing permissions, which determines who is able to do what with the trace configuration. As an owner of a trace configuration, you are able to modify its sharing permissions by adding and removing project roles, groups, and individual users (collectively: members) and assign permission to each member:
- Viewers can find, favorite, and run the trace configuration. Permissions are enforced during tracing, so each person's trace results may differ.
- Editors may also save their edits back into the trace configuration, overwriting prior settings. Suitable for delegating maintenance duties amongst teammates.
- Owners have full control over the trace configuration, including the ability to modify these sharing permissions, and rename or even delete the trace configuration.
Toolbar
Refresh the trace results by re-running the active trace configuration on current Jira data.
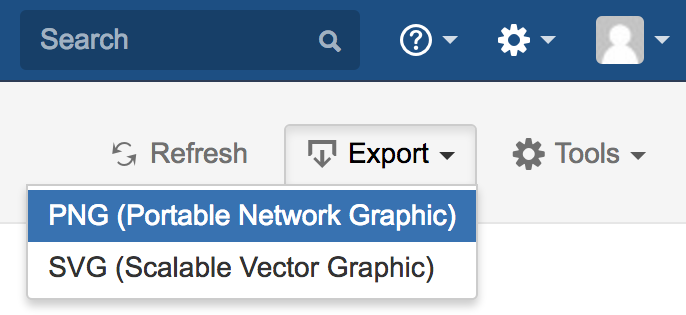
Refresh the graph in real-time, and export the trace in a variety of file formats.
| PNG (Portable Network Graphic) | Exports the current trace (issue relation graph) as a raster graphic in the PNG file format. Suitable for viewing and embedding as the PNG standard enjoys near universal compatibility. |
|---|---|
| SVG (Scalable Vector Graphic) | Exports the current trace (issue relation graph) as a vector graphic in the SVG file format. Most graph elements are cleanly scalable to nearly any size. Suitable for viewing and embedding on modern software and devices as support for this standard is gaining wider levels of support (as of 2016). The exported file is completely self-contained, but unlike the trace within Jira, only certain interactive features are included and usable. |
The Export feature requires a web browser that meets certain levels of compliance with web standards. Support for these standards among prevalent web browsers is not uniform, meaning that the quality of exported files might suffer. Vivid Trace makes limited attempts to detect browser support, and in cases where the web browser in use doesn't support specific export formats the associated Export menu items will appear disabled. Concretely, Google Chrome offers the best support, followed by Firefox. Exports are completely unsupported on Apple Safari and Microsoft Internet Explorer.
The export derives its data directly from the trace issue relation graph; the trace is not re-executed.
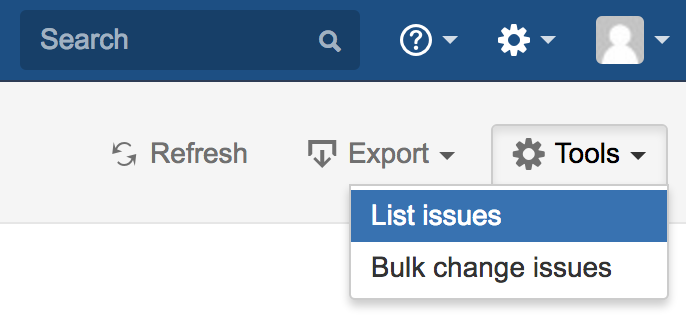
Perform operations on the graph as a whole.
| List issues | Produces a list of issue search results in Jira's Issue Navigator as an advanced JQL search query translated from the current trace. Essentially, it allows you to bring a graph into the Issue Navigator and manage the set of connected issues as a larger, singular unit. For example, you can view the issues in list form with a desired field view configuration, reuse the JQL query as a starting point for further investigation or discovery, or efficiently perform further processing with your other tools. Note that no ordering is specified in the listed issues. |
|---|---|
| Bulk change issues | Perform bulk operations on the issues produced from running the same trace on current Jira data. |
List issues and Bulk change issues find issues not by re-using the issues in the trace results but by executing the same trace configuration on current Jira data. The search results might differ from the issues appearing in the graph if the underlying issue and relation information has changed since the graph was generated.
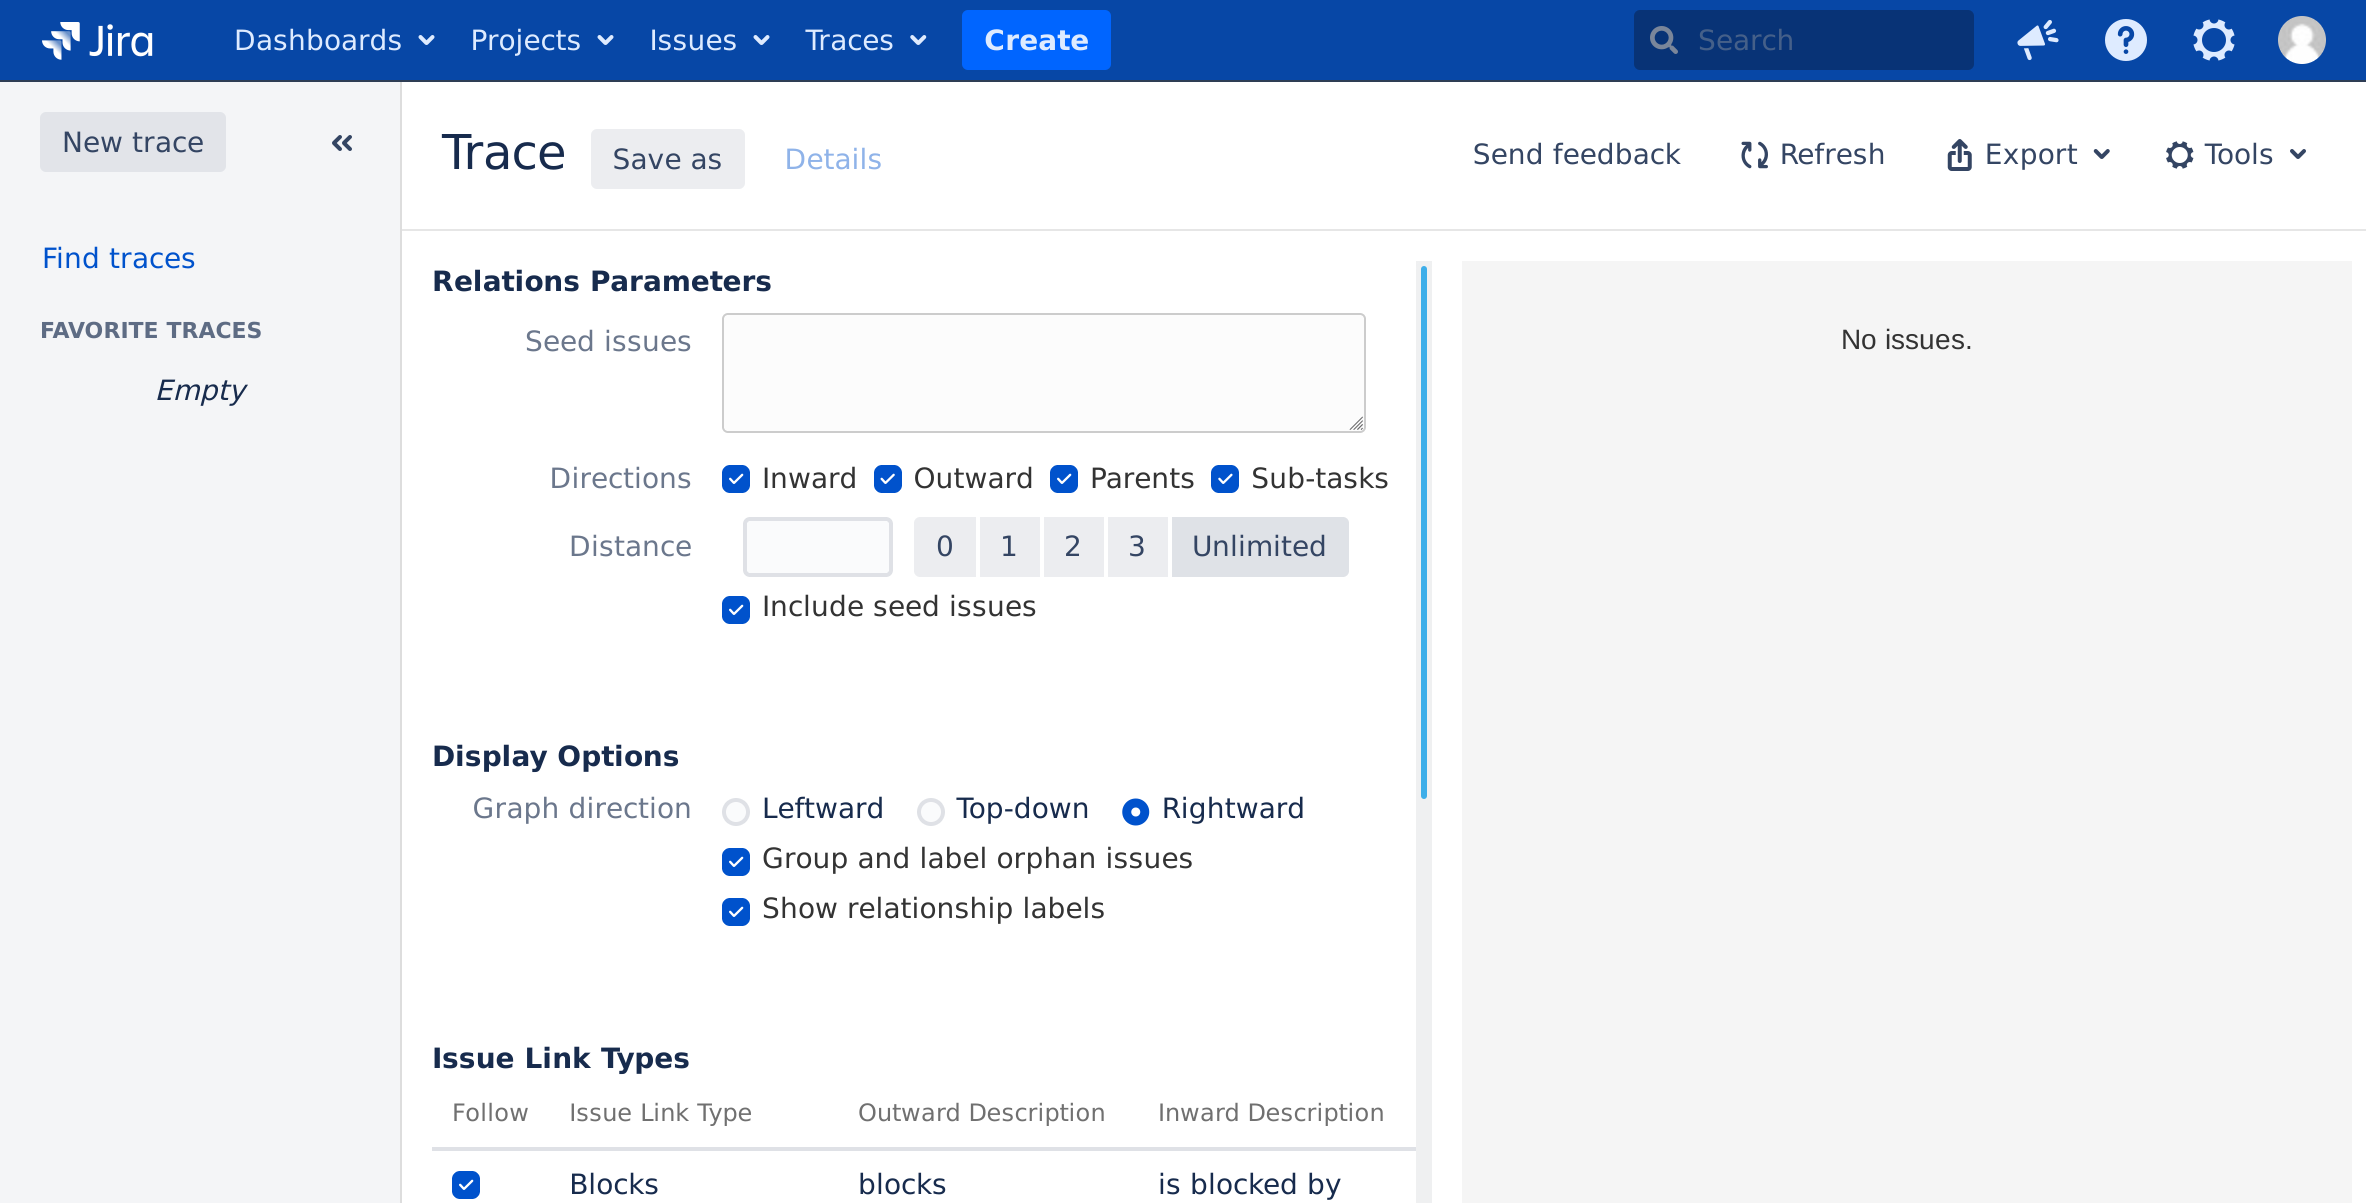
Relations Parameters
Press the Enter key to run the trace after inputing or editing the seed issue criteria.
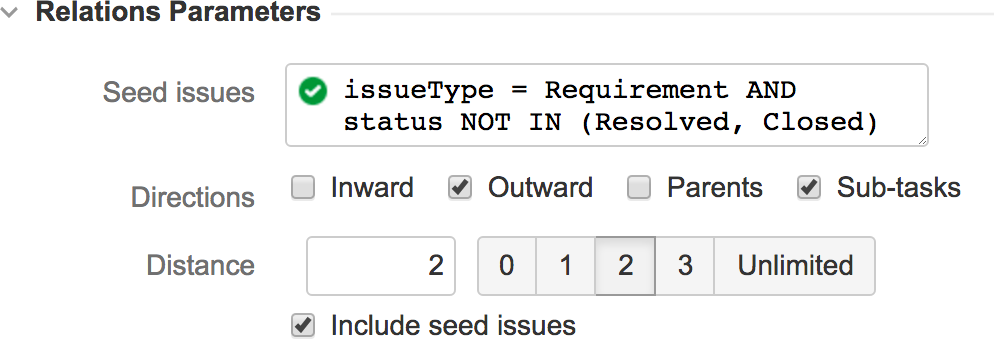
Input a whole number to limit the tracing distance, or select one of the presets.
The Relations Parameters component of the trace configuration specifies which issues to start tracing from and how the tracing process should proceed.
| Seed issues | The seed issues indicate the issues to start tracing from. Accepts a JQL query that produces issues, or one or more issue keys (separated with spaces and/or commas). This setting corresponds respectively to the issue and jql parameters of the relations() suite of JQL functions. |
|---|---|
| Directions | Directions controls which issue relationship directions are followed during the tracing process. Enabling Inward and/or Outward will cause the search to follow inward issue links and/or outward issue links, respectively. Likewise, enabling Parents and/or sub-tasks will cause the search to follow along parent issue and/or sub-task issue relationships, respectively. This setting corresponds to the direction parameter of the relations() suite of JQL functions. |
| Distance | When set to a whole number d, the Distance setting restricts tracing of issue relations to a maximum distance of d issues away from the seed issues in any direction. A value of 0 will prevent searching beyond the seed issues. While this input has focus, use the up & down arrow keys to quickly increment or decrement distance by one. A blank value means unlimited distance.This setting corresponds to the distance parameter of the relations() suite of JQL functions. |
| Include seed issues | Determines whether the seed issues are included in the results. When deselected, seed issues are omitted from the trace results. Chains of related issues that bottleneck through seed issues will be split, potentially orphaning some issues. This setting corresponds to the inclusive parameter of the relations() suite of JQL functions. |
Even if the distance is set to zero (0, meaning "graph only the seed issues"), the graph will show the relations between the traced issues according to the other settings in the trace configuration. This is useful for graphing the exact issues resulting from a JQL query.
The trace is re-run anytime a setting is changed.
Display Options

The Display Options component of the trace configuration controls arrangement and appearance of issues and relations in the trace results.
| Graph direction | Graphing of related issues proceeds in this direction. Note that changing the graph direction does not change writing direction, and that the contents of the issue relation graph is always left-justified. |
|---|---|
| Group and label orphan issues | Issues that appear in the trace results but have no relations to other graphed issues, according to the trace configuration, are treated as orphan issues. Enabling this setting will group orphans at the bottom of the graph. Orphans will be interspersed with their peers in the graph when this setting is disabled. |
| Show relationship labels | When enabled, the names of the relationships are written on the lines that relate given issues. For issue link relations the outward label is used. Overlapping relations are denoted using the nomenclature +n to indicate that, in addition to the labeled relation, n further relations exist between the two issues. |
The graph is redrawn whenever a setting is changed.
Issue Link Types
All issue link types in your Jira system are listed here.
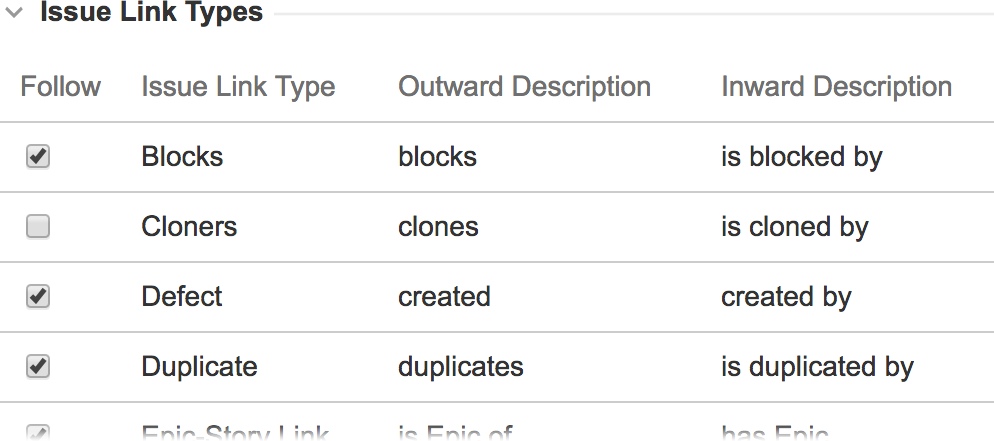
Click a checkbox, or anywhere in its row, to toggle the issue link type. Only enabled types are followed and drawn during tracing.
The Issue Link Types component of the trace configuration controls which issue link types are followed and ignored during tracing.
Issue relation graphs are calculated in part by following issue link relationships between issues when the Inward and/or Outward Directions parameters are set in Relations Parameters. Issue link relationships are explained in-depth in Issue Relation Graphs.
Deselect irrelevant and unwanted issue link types to trim them from the trace results. Given the example settings in the figure above, if clone relationships are producing irrelevant noise in your trace results, disable the "Cloners" issue link type. From then on, trace results will be calculated without following clone relationships, resulting in more concise graphs.
The issue link types setting corresponds to the issueLinkType parameter of the relations() suite of JQL functions. The trace is re-executed each time a setting is changed.
Artifact Types
All artifact types available in your system are listed here.
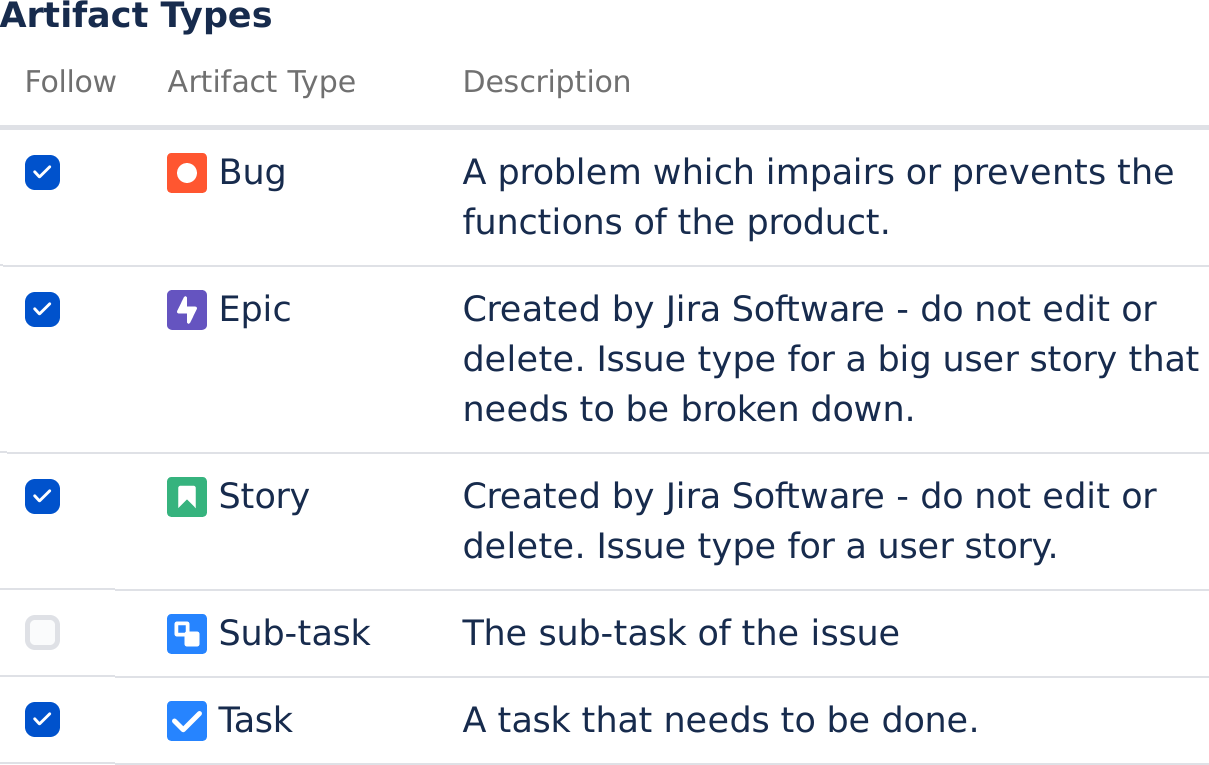
Click a checkbox, or anywhere in its row, to toggle the artifact type. Only enabled types are followed and drawn during tracing.
The Artifact Types component of the trace configuration controls which artifact types are followed and ignored during tracing.
Deselect irrelevant and unwanted artifact types to prevent them from being traced. The tracing process only follows enabled artifact types; all other types will be excluded from tracing and being presented in the results. Given the example settings in the figure above, Sub-task is disabled and so will not be traced or graphed in the results.
The issue link types setting corresponds to the artifactType parameter of the relations() suite of JQL functions. The trace is re-executed each time a setting is changed.
Issue Field Layout

Use the Issue Field Layout component of the trace configuration to design the issue field information that appears in issue lozenges in the trace results.
Issue Fields and Layouts explains usage and details the fields supported by Vivid Trace. Note that all issue fields available to you across all projects in Jira are available in the issue palette. The trace is re-run whenever the layout is changed.